Merced County 2023
Community Health Assessment
Data are a reflection of the lives of real people.


Written by Epidemiology Division
Produced by Health Equity and Communications Division
Released June 2023
A Special Thank You To
The Merced County Department of Public Health would like to acknowledge the following individuals whose efforts and contributions made the completion of this assessment possible. Countless months went into the collection, analysis, evaluation, and interpretation of data to make this document relatable and understandable for the intended audience - YOU.
Thank you to the following: Ravi Singh, Megan Black, Kristynn Sullivan, Cecilia Ramos, Joshua Sanders, Alejandro Villegas, Gloria Chavez, Melynna Chavez, Joselyn Ascencio, Francisco Higareda, Rafael Ornelas, Jason Young, Ivan Eser, and Alvin Collier.
Merced County Department of Public Health
Executive Leadership Team
Salvador Sandoval, MD, MPH, County Public Health Officer
Jessica Montoya-Juarez, MS, Assistant Public Health Director
Yadira Vazquez, MBA, Assistant Public Health Director
Letter from the Director


Vision:
A healthy place for all.
Mission:
To promote, protect, and preserve healthy living and safe environments
Values:
Equity, Innovation, Integrity, Leadership, Quality, Responsiveness, Service, Stewardship
Public Health, according to the World Health Organization, is defined as a state of complete physical, mental and social well-being and not merely the absence of disease or illness. Because of this, Public Health relies on multiple partners to achieve this outcome. The public health system is composed of public and private partners including hospitals, behavioral health, community services, private nonprofits, business, and many more. In short, public health is a shared responsibility.
One of the many responsibilities of Public Health includes collecting, analyzing and assessing multiple sources of data from federal, state and local agencies. The culmination of this exhaustive data review is the Community Health Assessment, a five-year report that provides detailed information on the status and well-being of the community in all aspects of health: access to care, chronic and communicable diseases, behavioral health, homelessness, public safety, child health, etc.
On behalf of the Merced County Department of Public Health, I am pleased to present the Merced County 2023 Community Health Assessment. It is my sincere hope that this report can be one of the many resources used by all to achieve a healthier and more equitable Merced County.
Rebecca Nanyonjo, DrPH
Director of Public Health
Acknowledgements
Merced County Board of Supervisors

Rodrigo Espinosa
District 1
Josh Pedrozo
District 2

Daron McDaniel
District 3

Lloyd Pareira, Jr.
District 4
Scott Silveira,
Board Chair District 5
County Executive Officer

Raul Lomeli Mendez
Merced County 2023 Community Health Assessment Partnerships
Special thanks to representatives of the following community organizations who provided valuable input toward the development of the Merced County 2023 Community Health Assessment as members of the All in For Health Equity Coalition and Health Leadership Council.
Alzheimer's Association
Association of Governments
Castle Family Health Centers
California Health Collaborative
Central California Alliance for Health
Central Valley Regional Center
City of Atwater
City of Dos Palos
City of Gustine
City of Livingston
City of Los Banos
City of Merced
Merced County and unincorporated areas
Community Initiatives for Collective Impact
Community Residents
Central Valley Opportunity Center
Cultiva La Salud
Dignity Health Mercy Medical Center, Merced
Emmanuel Hospital
Golden Valley Health Centers
Hispanic Chamber of Commerce
Hlub Hmong Center
Legacy Health Endowment
Livingston Community Health
Memorial Los Banos Hospital
Merced College
Merced County
Merced County Office of Education and County Superintendents
Merced Faculty Associates
Merced Lao Family Community Inc.
Merced-Mariposa Medical Society
National Association for the Advancement of Colored People
National Alliance on Mental Illness - Merced
North Valley Labor Federation
Parent Institute for Quality Education
University of California, Merced
United Way
Valley Children's Healthcare
Valley Onward
Youth Leadership Institute
Introduction
How data is used can be powerful. However, data alone, is limited and not helpful when it is not used to answer real life questions. This is what guides the work of the Merced County Department of Public Health’s (MCDPH) Epidemiology Division: transforming data into useful information for the community.
Epidemiology is the study and analysis of the distribution, patterns, and determinants of health and disease conditions in a set population. In other words, it is a method of using data to find the causes of disease and health outcomes in a community. Data can be gathered, used, and analyzed to create information. Information, when understood can lead to knowledge. Knowledge, especially knowledge held by groups can lead to transformational power. This transformational power over time can lead to community wisdom and generational transformation.
Information

Data
Knowledge
Power
Wisdom
Community
Generational
Transformation
This Community Health Assessment (CHA) takes data and creates accessible information for the community. This document includes a variety of data sources and types. The CHA includes both quantitative data, which is data collected on a numerical scale such as surveys, percentages, or death rates. It also includes qualitative data which is descriptive data from interviews with residents and key stakeholders – people who either live or work in Merced County. Data and sources include primary data, or data that was collected by the MCDPH, and secondary data, or data collected by other sources. Secondary sources come from a variety of levels, such as national (Centers for Disease Control or Federal Bureau of Investigation), state (California Department of Public Health, California Health Interview Survey), and other local sources (local hospitals or schools).
All data assessments represent a point in time. The MCDPH Epidemiology Division is constantly growing and learning and welcomes the community’s feedback on this document. This includes any information residents would like to see included, and any suggestions to make our next CHA even better. If this document is used for any grants, presentations or other purposes, or if there is a portion you enjoyed, we would appreciate that feedback as well. Please submit any feedback to PublicHealthCommunications@countyofmerced.com
Merced County
Methods of Data Collection
This section will describe the different sources and methods of data collection used for the Merced County Community Health Assessment. The type of data collected includes both quantitative and qualitative data, and sources include primary data from the Merced County Department of Public Health and secondary data from national, state, and other local sources. The data presented throughout this document aims to identify and provide a better understanding of our community’s current health status, needs, and issues.
Community Health Survey
The Merced County Department of Public Health used the online survey software SurveyMonkey as its primary source to collect data and information for this local health assessment. This was the best method of collection at the time the survey was disseminated, as the data was collected during the COVID-19 pandemic.
As part of this research, a total of 639 surveys were completed from December 2021 to April 2022 in English, Spanish, and Hmong. The community survey was completed by 49% females and 51% males. Although the survey was completed by community members from different races and ethnicities, the groups with most responses were White people (57%), followed by Black people (22%), then Asian people (10%), and Hispanic/Latino people (9%) meaning that Hispanic/Latino people were underrepresented in the results. 51% of community survey respondents reported completing their bachelor’s degree, followed by high school/GED graduates with a 14% participation rate. The majority of respondents were between 30-39 years old with a 60% participation rate, followed by 25-29-year-olds with a 21% participation rate.
This community health assessment is divided into sections including an in-depth analysis of the social determinants of health and the health of the community. Social determinants of health are an important part of our daily lives and through this assessment we identify and emphasize the significance they play in our quality of life. The health of our community section is divided into sub-sections including the leading causes of death and the most important health problems.
The topics for the sub-sections were selected based on data from the Merced County Department of Public Health 2021 Death Report and from the community survey responses. It is essential to highlight the leading causes of death in Merced County and provide an overview of the impact these have in our communities. Additionally, the most important health problems section topics were chosen based on the responses gathered from the community survey. This section provides deeper insight on what Merced County residents perceive to be the most important health problems in their communities.
Secondary Data Sources
The community health assessment also includes data obtained from national, state, and local surveys, reports, and fact sheets.
Key sources include:
California Department of Public Health
California Health Interview Survey, AskCHIS® (2017-2020)
California Healthy Places Index
California HIV/AIDS Policy Research Centers
Center for Disease Control and Prevention
Healthy People 2030
Local Merced County Department of Public Health Disease Surveillance Data
Merced College
Merced County Behavioral Health and Recovery Services
Merced County Department of Public Health Community Health Survey (2022)
University of California, Merced
U.S. Census Bureau
U.S. Department of Labor
Valley Children’s Healthcare
World Health Organization
Data Limitations and Information Gaps
Some indicators which required thorough investigation were not addressed due to the limitations of the data collected and gaps in information. Additionally, some sections of this assessment have more recent data while others have data from previous years due to the lack of availability. To the extent possible, data was collected to represent all of Merced County including its six incorporated cities and 11 unincorporated communities. Additional data was also sought to distinguish age groups, gender, and race or ethnicity in the county. In addition to demographic information, survey participants were also asked about their highest level of education. There was a large representation from participants with levels of education at the bachelor degree level which does not accurately capture or represent Merced County as a whole.
Population Characteristics
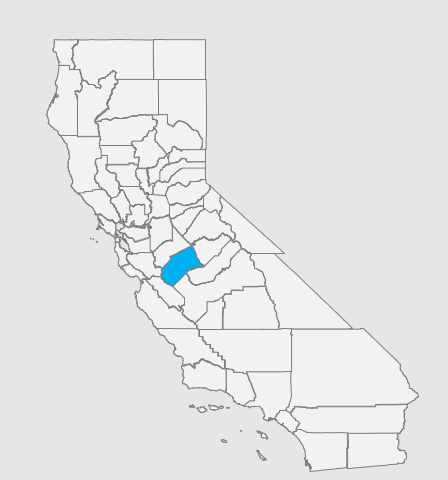
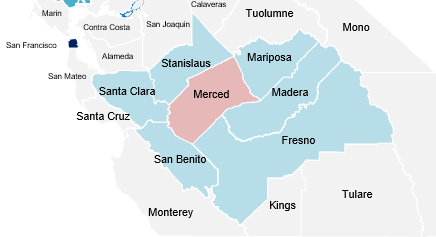
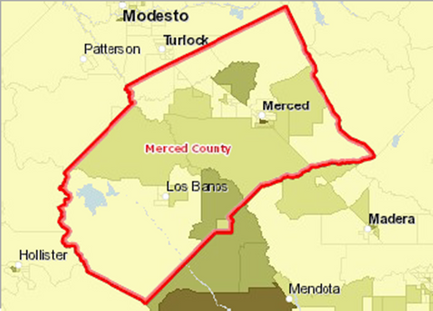
Known as the Gateway to Yosemite, Merced County is located in the heart of the San Joaquin Valley, which is one of the most productive agricultural areas in the world. The geographic area of Merced County is 1938 mi² (square miles), ranking it as the 25th largest county in California. There are six (6) incorporated cities and 18 unincorporated towns. The County seat is the City of Merced, which is also the largest city by population.
Population and People
Since 2010, the population of Merced County has steadily grown from 255,7931 residents to an estimated population of 286,4611 in 2021, representing a nearly 12% increase. People born outside of the United States (foreign-born residents) account for 26.5% of the County’s population, which is greater than the national average of 13.5%¹. In 2021, 4.5% of residents moved into Merced County from different areas, and roughly 0.7% of residents had relocated to Merced County from a different state or other country. ² Merced County has nearly equal makeup of males and females (50.5%, 49.5%). Approximately 4.7% of residents are veterans. ²
Rank | Community | Population Estimate |
1 | Merced | 91,563 |
2 | Los Banos | 47,044 |
3 | Atwater | 32,337
|
4 | Livingston | 14,760 |
5 | Gustine | 6,181 |
6 | Dos Palos | 5,820 |
The median age of Merced County residents is 31.1 years, which is young compared to the United States median of 38.1.
29.3% of the residents of Merced County are younger than 18 years of age, while only 11.4% are 65 and older.¹
Families and Living Arrangements
The average household size is 3.4 persons, and there is a total of 81,618 households in Merced County. ¹ 48.9% of households in Merced County are married-couple households, while 17.2% are single male households, and 25.5% are single female households. When looking at marital status and marital history in Merced County, 40.6% of county residents have never been married, which is slightly higher than the state (38.2%).
Income and Poverty
The Merced County median household income is $56,330, though there are areas within the county where the median household income is as low as $26,325. The median income for married-couple families (immediate family members) is $77,637, while the median income for non-immediate family member households in the county is $36,048. 23.5 % of Merced County residents live in poverty (the state in which an individual is unable to meet their basic needs of shelter, food and water).
Approximately 6.9% of households in the county do not have a computer compared to the California rate of 4.8%, and 11.4% of households in the county do not have a broadband internet subscription compared to 9.6% California households.
There are a total of 81,618 households in Merced County. There are 90,329 housing units with 51.6% being owner occupied. The median gross rent in Merced County is lower than the state median ($1,160 vs $1,750, respectively). Approximately 40% of Merced County residents pay between $1,000 - $1,499 per month. When looking at physical characteristics of housing units in Merced County, 25.2% of occupied housing units have four or more bedrooms, while most households in the county have between 2 to 3 bedrooms (67.1%).
Merced County Population by Gender 2019
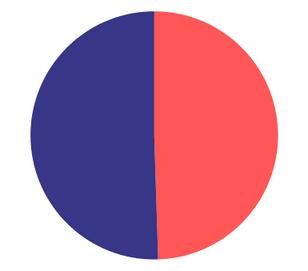
50.5%
49.5%
Male
Female
Total Population of Merced County 286,461
Source: US Census
1 in 4 Hispanic/Latino people live in poverty while 1 in 6 non-Hispanic/Latino people live in poverty. 23.2% of females live in poverty in comparison to 19.2% of males. ²
The breakdown of residents living in poverty by age
groups is as follows:
- Among those under the age of 18, 27.1% live in poverty
- Among the age group 18-64 years of age, 16.5% live in poverty
- Among those 65 years or older, 14.1% live in poverty. ²
Employment
The following data is a breakdown of employment classifications throughout the County. ²
Employment Classification |
70.1% of Merced County working residents identified as private company employees |
2.3% are self-employed in own incorporated businesses |
5.0% are classified as private not-for-profit employees |
16.5% work for the local, state, or federal government |
6.0% are self-employed in a non-incorporated business |
The average number of hours worked by Merced County residents who are employed is 38.6 hours per week. The median age for Merced County residents who are employed is 37.9 years. The top four industries for Merced County residents who are over the age of 16 and employed are educational services, healthcare and social assistance (22.0%), followed by Agriculture, Forestry, Fishing, Hunting and Mining (11.4%), and tied in third are Manufacturing (10.9%) and Retail Trade (10.9%).
Roughly 78.9% of Merced County residents who commute to work drive alone, while 9.1% carpool, 4.6% work from home, and the other 7.3% either walk, use public transit, or get to work through other modes of transport.
The total employment in Merced County decreased by 6.2% from 2020-2021.1 There are a total of 3,340 employer establishments in Merced County and over half (53.2%) of employer establishments in Merced County have less than 5 employees. ²
The top three most common occupations for Merced County residents who are employed and over the age of 16 is management, business, science, and arts (24.6%), followed by natural resources, construction, and maintenance (19.8%), and production, transportation, and material moving occupations (19.7%).²
5
61.0%
Education
The K-12 educational system in Merced County education serves a diverse group of 59,066 students in 20 school districts.⁴ There are two higher public education institutions, Merced College and the University of California, Merced. There are low rates of educational attainment in Merced County with only 69.4% of those 25 years or older having a high school diploma compared to 82.9% in California.¹ Though the high school graduation rate across Merced County school districts is 92.0%, the college enrollment rate is only 58.8%.²
When looking at higher education for those 25 years and older in Merced County, the disparity for Hispanic/Latino population widens. 32.0% of the Hispanic/Latino population have some college/associates degree or higher, compared to Asian (54.0%), White (50.0%) and Black (60.0%) people.⁵
Geography
Merced County is geographically large with several unincorporated towns disconnected from other major cities throughout the County. In Merced County, there are roughly 145.1 residents per square mile compared to California with a population density of 253.7 residents per square mile.¹
Race and Ethnicity
Merced County is one of the most culturally diverse regions in the United States. Merced County has a large portion of foreign-born persons (26.5%) compared to the United States (13.5%).¹ The percentage of the population in Merced County who are five years or older with limited English proficiency is significantly higher (22.7%) than the United States (8.4%) and slightly higher than California (18.1%).⁶ In households, 52.9% of persons 5 years of age or older living in Merced County speak a language other than English at home.¹
Merced County
Race/Ethnicity Breakdown 2019
0.8%
3.9%
7.8%
61.0%
26.5%
Hispanic/Latino
White
Asian
Black
Other
Source: US Census
Nearby Counties
The counties bordering Merced County are Stanislaus, San Benito, Mariposa, Madera, Santa Clara, and Fresno County.
Overview
Social determinants of health (SDOH) are the conditions in the environment where people are born, live, learn, work, play, and worship that affect a wide range of health outcomes.¹ There are five domains the SDOH can be grouped into: 1) Healthcare Access and Quality; 2) Education Access and Quality; 3) Social and Community Context; 4) Economic Stability; and 5) Neighborhood and Built Environment.


Education Access & Quality
Healthcare Access & Quality


Neighborhood & Built Environment
Economic Stability

Social & Community Context
Source: Healthy People 2030
SDOH play a major role in people’s health, well-being, and quality of life. They also contribute to health disparities and inequities.¹ For example, if there is limited access to grocery stores that carry healthy food options in a neighborhood, people living in this area might suffer from poor nutrition. This then raises their risk for health conditions such as heart disease, diabetes and obesity.
Health policy often focuses on after people get sick and go to the doctor. But, making upstream investments - policies and systems that address the root causes of the five domains of the SDOH - can result in a better overall community health before people get sick.
Healthcare Access and Quality
Access to high-quality healthcare that is both affordable and available when needed is a basic human right.
This access includes primary and specialist physical care, mental and dental health, and vision care. There are many factors involved when discussing access to healthcare, such as the availability of physicians and health services, insurance coverage, and the cost of healthcare along with other factors.
Most areas within the county are Medically Underserved Areas (MUA) and Health Professional Shortage Areas (HPSA). 91.8% of the Merced County population lives in a geographic area designated as a HPSA, which is significantly higher than both California (19.3%) and national (23.1%) percentages.¹ 1 in 3 adults do not have a regular doctor. Merced County, compared to the rest of California, has significantly higher rates of mortality (death) due to all causes, including chronic conditions, psychological distress, as well as other societal issues.² These issues are exacerbated because of the healthcare shortage in the county. The lack of available healthcare services directly contributes to the higher rates of mortality. According to a community survey 50% of residents agree or strongly agree that healthcare services, which include medical, dental, and behavioral, are located too far away.³
Source: Community Commons, October 2020
Uninsured Population, Percent by Tract, ACS 2015-19
Over 20.0 %
15.1 - 20.0 %
10.1 - 15.0 %
Under 10.1 %
No Data or Data Suppressed
Merced County, CA
47.6%
of Merced County residents receive Medicaid, compared to 28% in California and 22.2% in the US. ¹
91.8% of the Merced County population lives in a Health Professional Shortage Area.
Merced County has a slightly higher uninsured population compared to California (8.3% and 7.5%, respectively). There are areas within the county that are disproportionately uninsured compared to other areas.⁴ The area between 16th Street W Childs from M street to highway 99 (Census tract 16.01; median household income $26,325) has the lowest percentage of insured adults with only 59.8% having insurance, compared to the area between G street, E Bellevue Rd and E Yosemite (census tract 18.01; median household income $102,946) having the highest percentage of insured adults (97.9%).⁴ ⁵ Even though these two census tracts are less than 10 miles apart, such wide disparities exist in insurance coverage. One of the main barriers to accessing care is the high cost of healthcare.⁶ However, having health insurance mitigates these high costs. Having health insurance is extremely important to one’s health, as uninsured people have less access to recommended care, receive poorer quality of care, and experience worse health outcomes compared to those with insurance.⁷
Because of limited healthcare resources in the county, several barriers for accessing care are present, such as longer wait times for when an appointment is available. As previously mentioned, Merced County has high rates of mortality for numerous disease and conditions. Paired with generally low prevalence of the same disease, this pattern may indicate that residents are not receiving an adequate amount of preventative care.
Hispanic/Latino people have the highest uninsured rate in the county. Roughly 1 out of 11 do not have health insurance.
Availibility
Access
Helping consumers get care where and when they need it
Accessibility
Acceptability
Affordability
Accommodation
Source: Missouri Foundation for Health
Fewer people are diagnosed and more people are dying in Merced County, which indicates health conditions are not being caught early when treatment is most successful.
This leads to being diagnosed later when their chance of death is much higher. In other words, fewer people are diagnosed and more people are dying in Merced County, which indicates health conditions are not being caught early when treatment is most successful. Once diagnosed with a chronic condition, residents have many barriers to successfully manage those conditions, such as lack of access to convenient healthcare service locations or hours.
There are growing concerns that there will be a shortage of Primary Care Physicians (PCPs) in the coming years across the county, due to the country's increasing healthcare demands attributable to factors such as an aging population and population growth.⁸ The PCP rate for Merced County is 44.6 per 100,000 residents, which is lower than California (79.6) and the United States (76.6).¹ The data aligns with the community’s perception, as 57% of surveyed residents agree or strongly agree that people in the community are not able to get a routine medical checkup.
Just under half of respondents agree or strongly agree that people have limited access to healthcare services. Even though the county as a whole is considered a health professional shortage area, there are census tracts without a single primary care provider. There are 605 mental health providers in Merced County for 286,461 people. The ratio of the total county population to mental health providers is 460:1, meaning there are 460 Merced County residents for every mental health practitioner (California 240:1).⁹
49.0%
of Merced County residents surveyed agreed or strongly agree that the overall quality of healthcare is poor.³
There are 460 Merced County residents for every mental health practitioner, whereas CA has 240 residents to 1 practitioner.⁹
Rates of Primary Care Physicians (PCPs) by Location, 2019
RATE PER 100,000
80
60
40
20
0
79.6
9
76.6
44.6
Merced County
California
United States
LOCATION
Source: Community Commons
Low income residents and communities of color are more prone to difficulties in accessing healthcare resources, which can lead to inequitable circumstances. These groups tend to have worse health, which can possibly be related to their worse access. Not only do they receive less amounts of healthcare, but also lower quality of care. Language barriers can have an impact as well. Despite often worse and delayed care, nearly half of Merced County residents have significant medical debt.
Another indicator of late preventative care is Merced County’s rates of preventable hospitalizations. The rate, per 100,000 Medicare beneficiaries for preventable hospitalizations in Merced County is 57.0% higher than the rate for California and 14.0% higher than the national rate (Merced: 3,272; California: 2,087; and United States: 2,865).¹¹

A promising resource for Merced County is the opening of University of California, Merced’s medical school that will begin in 2023. Doctors trained in the Central Valley may stay in the Valley. In addition, children who grow up near a medical school may be encouraged to become doctors, near home.
42.9%
of Merced County residents reported having been unable to pay for basic necessities because of medical debt.
10


Possible Solutions to Improve
Healthcare Access and Quality
- Increasing the use of telehealth/telemedicine
- Paid Time Off (PTO) policy changes
- Provide transportation services to and from medical appointments
- Identify and support "qualified entities" in assisting with Medi-Cal enrollment in areas with high uninsurance rates
- Increase diversity amongst health professionals in the community that they are serving.
Education Access and Quality
Individuals with higher levels of education are more likely to live healthier and longer lives compared to their less educated peers, and the disparities are large and widening.¹
Merced County has low rates of educational attainment, with only 69.4% of those 25 years or older having a high school diploma, compared to 82.9% in California, and 87.7% in the United States.² Certain race/ethnicity groups have disproportionate levels of educational attainment. Most noticeably the Hispanic/Latino population (24.0%) and Asian populations (18.0%) have the highest percentage of residents 25 and older with only a high school diploma.³
When examining higher education for those 25 years and older in Merced County, the inequity for Hispanic/Latino widens, as only 32.0% of the Hispanic/Latino population have some college/associates degree or higher, compared to Asian, (54.0%) White, (50.0%) and Black people (60.0%).³
55.6 %
of residents surveyed agree or strongly agree that the quality of education is low.
6
Educational Attainment by Location, 2021
40%
Merced County
California
United States
30%
20%
10%
0%
30.0%
29.0%
29.0%
26.0%
27.0%
25.0%
35.0%
32.0%
20.0%
13.0%
11.0%
14.0%
5.0%
3.0%
2.0%
PERCENT
Some college or associates degree
Source: Town Charts
High school
or GED
Less than
high school
Bachelors degree or higher
No schooling
EDUCATION LEVEL
These trends are similar to both the state (Hispanic/Latino 52.0%, Asian 75.0%, White 67.0%, Black 66.0%) and United States (Hispanic/Latino 41.0%, Asian 72.0%, White 63.0%, Black 55.0%), however the percentages are lower for each race/ethnicity group in Merced County except for Black individuals.⁴ ⁵
There are two higher public education institutions in Merced County: Merced College, a community college established in 1962, and The University of California, Merced, established in 2005, the 10th and newest University of California campus.
Although Merced County has low rates of educational attainment compared to the state, the percentage of high school students who graduate is higher in Merced County (91.1%) compared to California (84.3%).⁷
During the COVID-19 pandemic, schools switched to online/remote learning. One area of concern from extended online learning was how this might impact student’s education. The California Assessment of Student Performance and Progress (CAASPP) is an annual standardized test that examines student’s abilities in various subjects, including math and reading proficiency. Proficiency is defined as a test score meeting or exceeding a student’s grade level standard. A comparison of 2019 (pre-pandemic) and 2021 (pandemic) was done to see if there was any difference in both reading and math proficiency for Merced County and California. The percentage of students who are proficient in reading and math decreased from 2019 to 2021 in both Merced County and California, indicating that the pandemic had a negative impact on student learning. Interestingly, the biggest differences between 2019 and 2021 proficiency levels were found in lower grades (3rd through 5th grade), and the smallest differences were found in higher grades (6th through 11th grade), which may suggest that remote learning was much more difficult for younger children.
Overall, the percent of students who are proficient in reading and math decreased from 2019 to 2021, however the percentage across all grades decreased more for Merced County compared to California. This could potentially be due to a number of factors, such as students in the county not having adequate resources, such as high-speed internet, a good working computer, and a quiet environment to focus. Also, schools in the county could have less resources as well, and as a result have more difficulties adjusting to online teaching.
Merced County has lower rates of reading and math proficiency than California, at every grade level.
7
Students Proficient in Reading (CAASPP), for Merced County by Grade Level, 2019 & 2021
60%
40%
20%
0%
43.7%
46.1%
45.4%
39.9%
41.0%
38.6%
39.2%
39.2%
38.6%
35.0%
32.6%
32.5%
41.0%
36.3%
29.0%
26.3%
Grade 3
Grade 4
Grade 5
Merced County 2019
Grade 6
Grade 7
Merced County 2021
Grade 8
Grade 11
All Grades
Source: kidsdata.org
GRADE LEVEL
Students Proficient in Reading (CAASPP), for California by Grade Level,
2019 & 2021
California 2019
California 2021
60%
40%
20%
0%
39.8%
49.5%
41.5%
51.7%
46.5%
48.5%
43.6%
51.4%
50.0%
49.4%
47.4%
59.2%
57.3%
50.9%
49.0%
48.5%
Grade 3
Grade 4
Grade 5
Grade 6
Grade 7
Grade 8
Grade 11
All Grades
Source: kidsdata.org
GRADE LEVEL
Students Proficient in Math (CAASPP), for Merced County by Grade Level,
2019 & 2021
Merced County 2019
Merced County 2021
50%
40%
30%
20%
10%
0%
40.6%
23.6%
34.2%
22.9%
25.4%
14.7%
25.0%
14.7%
23.9%
19.0%
22.0%
14.5%
18.5%
16.6%
26.8%
Grade 3
Grade 4
Grade 5
Grade 6
Grade 7
Grade 8
Grade 11
All Grades
18.1%
Source: kidsdata.org
GRADE LEVEL
Students Proficient in Math (CAASPP), for California by Grade Level, 2019 & 2021
California 2019
California 2021
50%
50.2%
39.7%
44.9%
35.9%
38.0%
30.1%
38.5%
30.8%
37.9%
34.4%
36.6%
30.8%
34.4%
32.2%
39.7%
50.2%
40%
30%
20%
10%
0%
Grade 3
Grade 4
Grade 5
Grade 6
Grade 7
Grade 8
Grade 11
All Grades
33.8%
Source: kidsdata.org
GRADE LEVEL
The relationship between health and education is complex. Students who are socioeconomically disadvantaged often experience delays in academic development which, as a result, leads to poorer academic outcomes. These socioeconomic disadvantages include: poor nutrition, high crime neighborhoods, and lack of safe places to walk and play. This results in poorer academic outcomes than children from higher socioeconomic status groups. This is especially important as a lack of education can lead to being unhealthy in adulthood, and unhealthy children can lead to a lack of education. In Merced County, 31.9% of students who are socioeconomically disadvantaged, compared to 54.6% who are not socioeconomically disadvantaged, meet or exceed grade level standards in English Arts. For math proficiency, a similar pattern is found. 14.9% of socioeconomically disadvantaged students meet or exceed grade level standards, compared to 30.9% of non-socioeconomically disadvantaged. This is problematic, as if these patterns continue to exist the gap will continue to widen as students continue their education. This will put socioeconomically disadvantaged students at a major disadvantage throughout their life, as they will have less chances of graduating high school, attending college, and obtaining better employment which all lead to a better quality of life and overall health.
Even though a higher percentage of students graduate high school in Merced County compared to the state, only 35.1% complete college preparatory courses in Merced County compared to 50.5% in California.⁷
Examining this by race/ethnicity, 1 out of 4 Black, 2 out of 5 White, 2 out of 3 Asian or Filipino, and 3 out of 10 Hispanic/Latino students take college preparatory courses in Merced County.⁷ Higher educational attainment usually leads to better employment opportunities, higher earning potential and better overall health. College preparatory courses are not available equally to all students, and this contributes to certain groups, such as Latino, Black, and low-income students, being consistently underrepresented in higher education. There is research demonstrating that improving college access and completion could also benefit society by increasing tax revenue while reducing economic inequality, unemployment, poverty, incarceration, and demand for safety net programs.⁸
Researchers have examined the association between education and health and the relationship is quite complex. Three main connections explain how education and health are linked.
14.9 %
of socioeconomically disadvantaged, compared to 30.9% of non-socioeconomically disadvantaged, students meet or exceed grade level standards in mathematics in
Merced County.⁷
12.7%
of staff reported that truancy, or cutting class, is a problem at high school in Merced County compared to 18.5% in California.⁷
High School Graduates Completing College Preparatory Courses by
Location & Race/Ethnicity, 2019
Merced County
California
80%
60%
40%
20%
0%
40.0%
64.3%
75.1%
66.7%
66.8%
31.3%
43.6%
42.9%
55.2%
Black
Asian
Filipino
Hispanic /Latino
White
PERCENT
25.0%
Source: kidsdata.org
RACE
Education can create more opportunities for better health
Income and resources
Higher educated people are more likely to get jobs that provide health insurance, paid time off, and retirement compared to those with less education who are more likely to work in high-risk occupations with limited benefits. Families with higher earnings are able to afford healthy foods, have more time to exercise regularly, and pay for health services and transportation. Conversely, low wages, job insecurity, and a lack of assets associated with less education can make families more vulnerable during difficult times, which in turn can lead to poor nutrition, unstable housing, and unmet medical needs.⁹
Healthier neighborhoods
Those with less education, who typically have lower incomes and fewer resources, are more likely to live in low-income neighborhoods, which often times lack the resources needed for good health. These types of neighborhoods tend to have an oversupply of fast food restaurants and other unhealthy food options (food swamps) while having limited healthy food options (food deserts). Lower income neighborhoods might not have sidewalks or parks to encourage outdoor physical activity compared to neighborhoods that are more affluent. Low income and rural areas, which are often populated by people with less education, suffer from shortages of healthcare providers and resources. Crime is more prevalent in lower income neighborhoods, which exposes residents to greater risk of trauma and deaths from violence along with the stress that comes with living in an unsafe neighborhood. Public schools in these neighborhoods are given less resources (because of low property taxes), resulting in fewer high-quality schools and perpetuating the education, income and health cycle. Higher level of toxins, such as water and air pollution, pesticides, and hazardous waste are found in lower income areas. Lastly, there is less effective political influence to advocate for community needs, which results in a persistent cycle of disadvantage.⁹
Social and psychological benefits
Those with more education, thus higher incomes, are often spared the health harming stresses that accompany continued social and economic hardship. Typically, those with lower educational attainment have fewer resources, such as social support and high self-esteem, to buffer the negative health effects of stress. Education and other learning opportunities help build skills and advance traits that are not only important throughout life but also are important for good health. Some of these things include perseverance, flexibility, a sense of personal control, and establishing social networks, which are all valuable for dealing with an assortment of life challenges that may influence health. Also, higher educated people typically have more robust social networks which in turn allows connections to resources that may help deal with stress, reduce hardships and improve overall health.⁹
Health behaviors
Education not only helps prepare people for better jobs, but those who are more educated are more likely to learn about healthy behaviors.⁹ Patients who are more educated are able to better understand their health needs, follow instructions from their health care provider, advocate for themselves and their families, and effectively communicate with their health care provider. Educational attainment is low in Merced County, which is directly related to the poor health outcomes that are seen in the community. 61% of Merced County residents surveyed agree or strongly agree that there is a lack of knowledge or education on how to live a healthy lifestyle.⁶
Poor health that affects education (reverse causality)
As mentioned above, the relationship between education and health is complex. Not only does poor health result from lower educational attainment, but it can also cause educational setbacks and interfere with schooling. For example, a child with a chronic disease, such as diabetes, might miss class frequently and may fall behind. Disabilities and unhealthy behaviors, such as smoking, have established links to school performance and all have a significant impact on educational outcomes. Lack of education can lead to unhealthy adults, and unhealthy children can lead to a lack of education.⁹
Conditions throughout the life course – beginning in early childhood – that affect both health and education
Throughout one's life, conditions at home - socioeconomic status as well other contextual factors - creates stress. This stress causes illness and deprives people of resources needed to be successful in school, at work, and living a healthy lifestyle. A nurturing home environment, parental involvement, stimulation and early childhood education are all critical components that help develop social and learning skills during early childhood when health and education paths are shaped. 47.1% of the population ages 3 to 4 in Merced County are enrolled in school, which is lower than the state and national percentages (49.7% and 48.3%, respectively).¹⁰
Two of the biggest resources in the county are Merced College and the University of California, Merced. Opening in 2005, one of the missions of UC Merced is to increase college-going rates among students in the region, specifically the San Joaquin Valley. Now, 17 years later UC Merced has been extremely successful in achieving this mission and proves to be a major asset to the community. One of UC Merced’s unique characteristics is the ethnic diversity of student enrollment, which is similar to the diversity seen in the community and is one of the most ethnically diverse university's in the country. 54.7% of the enrolled student population is Hispanic/Latino, 17% Asian, 9.6% White, 4.3% Black, 3.2% multi-racial, 0.5% Native Hawaiian/Pacific Islander, and 0.1% American Indian/Alaskan Native.¹¹ Another way UC Merced continues to benefit minorities and promote racial/ethnic diversity is by admitting first-generational residents. UC Merced had the highest percentage of first-generation resident freshmen admissions (59.0%) of all the University of California schools. Merced College’s population is diverse as well, with the student population breakdown of 59.2% Hispanic/Latino, 17.9% White, 8.3% Asian, 3.0% biracial, 3.0% Black, 0.5% American Indian/Alaska Native, and 0.2% Native Hawaiian/Other Pacific Islander.¹³
Enrollment in School, Children (Age 3-4), Percent by Tract, ACS 2015-2019
Over 55.0%
45.1% - 55.0%
35.1% - 45.0%
Under 35.1%
No Population Age 3-4 Reported
No Data or Data Suppressed
Merced County, CA
Source: US Census, ACS 2015-2019
Possible Solutions to Improve Education Access and Quality
- Make sure schools have necessary funding & resources (especially those in low socioeconomic areas)
- Better educational infrastructure
- Improve access to advanced technology
- Expand a ‘Local Admissions Area’ program at UC Merced for freshmen and transfer students
- Increase enrollment in head start programs and preschool
Social and Community Context
The connections you have to your community (i.e. family, friends, co-workers, and neighbors) have a major impact on overall health status and well-being.¹ It is important to focus resources on getting people the social support needed in the places they work, live, learn and play, as this is where health really begins. Because so many of the factors that impact health are out of people’s control, having positive relationships at home, work and with those in your community can help reduce these negative impacts on health.² In fact, your social and community context are more likely to influence your health than health behaviors.¹ The quantity and quality of your social relationships have a direct impact on overall health, such as mental health, health behavior, physical health and mortality risk.¹ Having strong friendships and a support system help improve overall health.

Source: stangarfield.medium.com
A community survey found that 44.8% of surveyed Merced County residents agree or strongly agree that there is a lack of social support, and 40.6% agree or strongly agree that there is a lack of family support.³ 39.0% of Merced County residents reported being unable to work between 8 and 30 days because of mental problems.⁴ If people had a stronger support system there would be less people having to miss work because of their mental health. This aligns with the community perception of there being a general lack of social support and family support system. This same community survey also found that 55.6% of residents agree or strongly agree that discrimination or racism is present and that 42.4% of surveyed residents feel that residential segregation (physical separation of two or more groups into different neighborhoods) is a common issue.³ Social cohesion can help promote the overall health of the community by improving conditions that affect the wellbeing of people.
Possible Solutions to Improve Social and Community Context
- Make health the priority of the county
- Lower amount of discrimination/racism taking place in the community through advocacy to build public support for policies pursuing equal opportunities for all individuals
- Improve social/family relationships by offering various services for resources such as counseling
- Actively recruit and hire a racially and ethnically diverse staff for well-paying jobs with benefits
- Organize community-wide cleanup or rebuilding campaigns to bring community members together
- Ensure all communities in the county are being allocated equal amount of resources
- Promote and encourage the participation of citizens at town hall meetings
Economic Stability
People with steady employment with a livable wage are less likely to live in poverty and more likely to be healthy; however, many people have a difficult time finding, as well as keeping a well-paying job. Those who have disabilities, chronic conditions, injuries or other health issues may not be able to work, or are limited in their ability to work. Even those who are fully able to work and have steady employment may have difficulties earning enough money to stay healthy, or with benefits such as health insurance or paid sick time.
The unemployment rate in Merced County had been steadily declining over the past 10 years until the COVID-19 pandemic. In 2020, unemployment rates across the country drastically increased as a direct result of the pandemic and economic shutdowns. The unemployment rate in Merced County (12.2%) is much higher than California (10.2%) and the United States (8.1%). 58.0% of surveyed residents agree or strongly agree that there is limited access to jobs in the county.²
1 in 5 Merced County residents are living in poverty (21.2%), which is much higher than the state (13.4%) and United States (13.4%) when using the <100% Federal Poverty Level (FPL).³ A higher percent of females live in poverty compared to males in the county (23.2% and 19.2%, respectively) which is a similar trend to both the state and nation.³
When examining disparities for poverty by ethnicity, 1 in 4 Hispanic/Latino people live in poverty while 1 in 6 non-Hispanic/Latino people live in poverty.
Highlighting these inequities by race, “other” race had the highest percentage of the population in Merced County living in poverty (26.3%), followed by Native American/Alaskan Native’s (26%), Black (24.4%), Asian (21.1%), multiple race (20.1%) and White (18.5%).³
Unemployment by Location, 2011-2020
Merced County
California
United States
20%
15%
10%
5%
0%
17.9%
16.6%
10.5%
8.1%
14.7%
13.0%
9.0%
7.6%
7.4%
6.2%
11.4%
6.3%
5.3%
10.6%
5.5%
9.4%
4.8%
8.5%
4.3%
8.2%
4.1%
12.2%
11.9%
10.2%
9.0%
8.1%
4.9%
4.4%
3.9%
3.7%
2011
2012
2013
2014
2015
2016
2017
2018
2019
2020
PERCENT
YEAR
Source: US Department of Labor
Percent Living in Poverty by
Gender & Location, 2015-2019
Male
Female
25%
23.2%
14.4%
12.3%
14.6%
12.2%
20%
15%
10%
5%
0%
Merced County
California
United States
PERCENT
19.1%
LOCATION
Source: US Census Bureau
Percent Living in Poverty by
Ethnicity & Location, 2015-2019
Hispanic/Latino
Not Hispanic/Latino
25%
20%
15%
10%
5%
0%
16.2%
17.7%
10.6%
19.6%
12.1%
Merced County
California
United States
24.6%
PERCENT
LOCATION
Source: US Census Bureau
Percent Living in Poverty, by Race & Location, 2015- 2019
Merced County
California
United States
30%
20%
10%
0%
24.4%
23.0%
20.5%
26.0%
24.9%
19.5%
21.1%
12.2%
11.2%
10.9%
10.2%
26.3%
17.5%
13.3%
21.0%
18.7%
20.1%
16.7%
12.4%
4.5%
PERCENT
18.5%
White
Black/
African American
Native American/ Alaskan Native
Asian
Native Hawaiian/ Pacific Islander
Some other race
Multiple race
RACE
Source: US Census Bureau
The number of children living in poverty has decreased in recent years, however nearly 1 in 3 children in Merced County still live in poverty (<100% FPL is 29.8%), which is more than 61% higher than both the state (18.1%) and US (18.5%) percentage.³
Housing
The median home price in Merced County ($425,000) is less than half of the median home price in California ($856,600).⁴ Although the cost of purchasing a home is much lower in Merced County compared to California, many locals are finding it difficult to afford homes in their communities. An analysis done in April 2022 found that Merced County is ranked 15th on the list of the top United States counties where homeownership is recently unaffordable.⁵ The median household income in Merced County is $56,330 (California: $78,672, United States: $64,994).⁶ The estimated mortgage, with a 3% down payment, would approximately be $3,200 per month. The financial recommendation is that no more than 33.0% of the monthly income should be spent on a mortgage or rent. Using this estimate, $1,550 should roughly be the cost of a mortgage or rent, based on the median income in the county. The fair market rent price for a three-bedroom house in Merced is $1,591.⁷ The data aligns with the community’s perception, as 60.6% of surveyed Merced County residents agree or strongly agree that the average income in the county is low and 42.7% agree or strongly agree that there is no affordable housing.²
23.8%
of the unhoused population have serious mental health problems, 48.8% have a physical disability & 27.5% have developmental disabilities.⁸
Number of Unhoused Merced County,
2016 - 2019
TOTAL NUMBER
750
500
250
0
607
514
519
454
2016
2017
2018
2019
YEAR
Source: MCBHRS Homeless Plan
After a decrease from 2016 to 2017, homelessness has increased in
recent years.
In 2019 the 607 unhoused in Merced County in 2019, 322 were sheltered, while 285 were unsheltered. Of these, 7 children were unsheltered and 101 children were sheltered. Of the 278 adults that were unsheltered, 64.7% are male and 41.7% are White and 39.9% are Hispanic/Latino.⁸ Compared to California, the percent of unhoused public-school students is 1.6% higher in Merced County (4.5% and 2.9%, respectively).⁹
46.3%
of the unsheltered homeless adult population are chronically homeless.
8
27.5%
of the unhoused population are victims of domestic violence.
8
Merced County Unsheltered Adult Homeless Population by
Race / Ethnicity, 2019
11.2%
6.8%
41.9%
40.1%
Hispanic / Latino
White
Black
Other
Source: MCBHRS Homeless Plan
Economic Development
Merced County has great potential to improve the economic well-being and quality of life of its residents. Merced County’s unique location of being in the central part of California, which is the 6th largest economy in the world and largest economy in the United States, is advantageous for many reasons. The west side of Merced County is located near the Bay Area, roughly one hour from the heart of the Silicon Valley. Because of this, Merced County can provide different facilities (such as test, development, and production facilities) that support nearby research operations. A major advantage and reason the region is attractive to businesses is that there is more space available in the county (as space becomes more limited and real estate continues to increase at higher rates in the Silicon Valley), and it provides a lower cost to do business because of more affordable real estate. In addition, because of the county’s strategic location, it offers extensive supply chain transportation infrastructure and proximity to large California markets, which are all attractive to businesses in multiple sectors.¹⁰ Attracting more businesses to the region will lead to more stable and higher-paying jobs, thus improving the economic stability of the county and in turn the overall health of the community.
Possible Solutions to Improve Economic Stability
- Increase the number of low-income housing units being built
- Research other models for affordable housing solutions
- Promote higher paying jobs in the region, such as jobs in healthcare
- Establish ongoing rental and utility assistance programs for those living in poverty
- Encourage employer funded benefits and minimum wage jobs offering paid sick time
- Expand local outreach to help identify homeless populations and link them to resources
Neighborhood and Built Environment
Neighborhoods
The neighborhoods individuals live in have a significant impact on their overall health and well-being. Often times the challenges and dangers that people face, such as unsafe neighborhoods and crime, are out of their control. However, these things have a major impact on their health and safety over the course of their lives. A safe and clean environment that allows access to recreational activities and healthy foods is extremely important in order to maintain as well as improve the health of the community.
Many of the risk factors that you can change for chronic diseases are directly linked to the different social determinants of health (SDOH), such as neighborhood and built environment. Sometimes there are situations that are out of one’s direct control, usually because of a lack of resources, such as adequate income. For example, a person might choose not to smoke because they are aware of the negative health impacts, yet they live in low-income housing where a majority of the people smoke frequently.
Even though this person is not directly putting himself or herself at risk by smoking, because of their environment and inhaling second hand smoke they are still at an elevated risk of developing lung cancer, asthma and other respiratory illnesses.
6.1%
of housing units in Merced County are vacant, which is lower than both the state (8.0%) and US (12.2%).³
Substandard housing
Substandard housing is federally defined as having at least one of the following: 1) incomplete plumbing facilities, 2) incomplete kitchen facilities, 3) more than 1.01 occupants per room, 4) rent or mortgage of greater than 30.0% of monthly income. 39.5% of Merced County housing units meet one or more of these conditions, which is lower than California (43.8%) but higher than the United States (31.9%).¹
14.9%
of housing units are overcrowded in Merced County
(CA: 12.5%, United States: 4.4%).³
Crime
In Merced County, the property crime rate has been decreasing over the last six years (2015-2020), with the exception of a slight increase from 2018 to 2019. Property crimes include burglary, larceny-theft, motor vehicle theft, and arson. The property crime rate, using the same 2016 data source available for Merced, California and the United States, is 2,762 per 100,000 for Merced County, which is higher than both the state and national rate (2,497 and 2,466 per 100,000, respectively.²
Unlike property crimes, the number of violent crimes has remained stable the past six years. The violent crime rate in Merced County is 583 per 100,000 population, which is higher than both the state and national rate (441 & 416 per 100,000, respectively).
The most common crime in Merced County is larceny-theft, followed by vehicle theft, aggravated assault, and burglary. Of the cities in Merced County, Atwater has the highest property crime rate (2,781), followed by Merced (2,258) and Los Banos (2,049). Dos Palos has by far the highest rates of violent crime (1,242), followed by Merced (778) and Los Banos (483). Gustine has the lowest rate of both violent and property crime.⁴
Results from a community survey suggest that 54.5% of residents perceive that community violence or crime is a problem, 46.5% of resident’s perceive the streets are unsafe, and 49.1% agree or strongly agree that there is a lack of safe housing in the county. Half of surveyed respondents agree or strongly agree that racial based violence is a problem in the community, and 37.6% feel that gun violence is a problem.⁵
Property crime rates in Merced County are at a
6-year low.
Merced County Crime Rates, 2015 - 2020
RATE PER 100,000
2956
Violent Crime
Property Crime
3,000
2,000
1,000
0
2833
550
2616
570
2439
558
2460
542
622
2100
586
2015
2016
2017
2018
2019
2020
YEAR
Source: CA Department of Justice
Merced County Crimes by Type, 2020
0.3%
17.7%
43.6%
16.9%
17.1%
1.1%
3.3%
Homicide
Rape
Robbery
Aggravated Assault
Source: CA Department of Justice
Burglary
Motor Vehicle Theft
Larceny - Theft
Merced County Violent vs Property Crime Rates, by City, 2020
Violent Crime
Property Crime
3,000
2,000
1,000
0
2049
1856
452
2781
2258
1702
1707
1242
475
778
147
Los Banos
Livingston
Gustine
Atwater
Merced
Dos Palos
RATE PER 100,000
483
Source: CA Department of Justice
LOCATION
Access to food
Another often-overlooked component of the neighborhood and built environment social determinants of health (SDOH) category, which is linked to overall health status, is whether there is equitable access to healthy food options throughout the county.
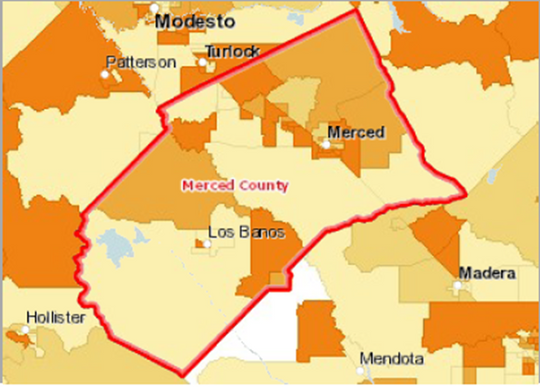
Much of the county is considered low access (see pink to the right). Low access is defined as a census tract in which at least 500 people, or 33.0% of the population, lives further than one mile for urban or 10 miles for rural from the nearest supermarket.⁶
When examining areas within the county that are both low access and low income, a majority of the population in the county lives in an area that is considered both (see green below). Low income is defined as a census tract that has a poverty rate of 20.0% or higher, or the tract has a median family income less than 80.0% of the median family income for the state or metropolitan area. Pink areas are low access but are not considered low income, while green areas are both low access and low income.⁶ Almost half of surveyed community residents agree or strongly agree there are areas with no grocery stores present and 41.2% agree or strongly agree there are limited healthy food options or healthy groceries, both of which align with this data.⁵
There are less fast food restaurants per capita in Merced County (56 per 100,000) than both California (87.3) and the United States (82.2), yet 60.0% of surveyed residents agree or strongly agree that there are too many options for unhealthy eating choices such as fast food restaurants.⁷ ⁵
Food Access in Merced County
Low Access
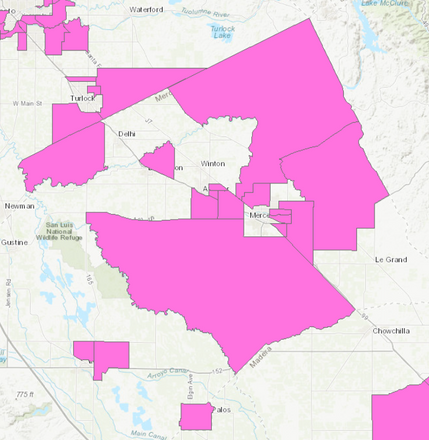
Source: US Department of Agriculture
Merced County received a failing grade from the American Lung Association’s State of the Air report on all 3 air quality measures (ozone, pm 2.5, & particle pollution annual).
Food Access in Merced County
Low Access
Low Access and Low Income
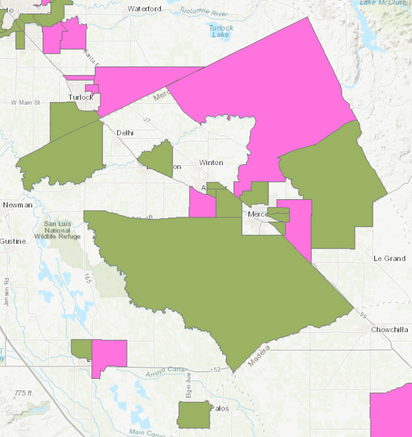
Source: US Department of Agriculture
Air quality
Air quality is another component of the built environment that has a direct relationship with health. Air pollution is considered the world’s largest environmental health threat and causes or exacerbates many diseases, from asthma, cancer, and pulmonary illnesses to heart disease.⁸ The San Joaquin Valley has poor air quality and has some of the most polluted air in the nation.⁹ Similar to the rest of counties in the San Joaquin Valley, Merced County experiences much poorer air quality than the rest of the state because of the geographical nature of the Valley - pollution from the state enters and stays in the Valley basin. The chronically bad air quality, over time, can lead to more respiratory issues because of the long-term exposure to poor air quality. Ozone levels in Merced County have dramatically decreased since the early 2000’s but are still above healthy levels.¹⁰ Merced County ranked 25th for most polluted counties in the nation for ozone and ranked 17th for short term particulate matter (24 hour PM ) particle pollution. Fresno ranked number 1 for short-term particle pollution. When looking at long-term particulate matter (Annual PM ), Merced County ranked 15th in the nation, while Mono county ranked first. Merced County had 4 days where particulate matter 2.5 levels were above the National Ambient Air Quality Standard, compared to only 1 in California and 0 in the United States.¹¹
34.6% of surveyed residents agree that the air quality is poor in Merced County, while 11.5% strongly agreed. This is similar to findings from a study that was done in the San Joaquin Valley where 32.1% of respondents answered the air quality in the region was unhealthy for sensitive groups.¹²
Climate Change
Related to air quality, climate affects health as well. Climate change is already impacting health in a number of ways, including leading to increased mortality and morbidity from frequent extreme weather events such, as heatwaves.¹³ California has seen the average temperature in recent years increase. Interestingly, of all California counties, Merced County has the smallest percentage increase for 2021 average temperature by month when comparing the mean monthly temperature for 1901-2000. In other words, Merced County has actually seen the smallest average temperature increase in the state over this period of time. Although the county has experienced the lowest average temperature increase, climate change related health risks are still a major concern as they disproportionately impact vulnerable and disadvantaged populations the most, including women, children, ethnic minorities, poor communities, migrants, older populations, and those with underlying health conditions.¹³
The general perception of surveyed residents is that there are several neighborhood and built environment factors that negatively impact the health of the community and can explain why the health of the community is poor. 42.7% of respondents agree or strongly agree that there are no sidewalks in many neighborhoods and 53.2% agree or strongly agree that there are limited parks, playgrounds or green spaces in the community.⁵ 81.3% of children in Merced County live in walking distance to a park, playground or open space, however this is lower than the percent of children in California (88.0%) with similar access. Even though a majority live within walking distance to these areas in Merced County, 1 in 5 do not. 42.7% agree or strongly agree that there is limited access to recreation or things to do.⁵ Merced County has lower access to recreation and fitness facilities compared to California and United States (Recreation and Fitness Facilities, rate per 10,000 Population: Merced County 0.9, California 1.2, United States 1.2).³
3 of 7 surveyed Merced County residents agree or strongly agree that there is limited availability or accessibility to public transportation.⁵

Vulnerability factors
Health outcomes

Injury
and mortality
from extreme weather events


Heat-
related
illness
Respiratory
illness
Water-borne diseases and other water-related health impacts
Zoonoses


Vector-borne diseases
Malnutrition and food-borne diseases


Chronic
diseases
Mental and psychological health
Health systems
& facilities outcomes


Impacts on healthcare facilities
Effects on health systems
- Demographic factors
- Geographic factors
- Biological factors & health status
- Sociopolitical conditions
- Socioeconomic factors


Exposure pathways
- Extreme weather events
- Heat stress
- Air quality
- Water quality and quantity
- Food security and safety
- Vector distribution & ecology


Climate-sensitive health risks
Climate Change

Vulnerability


Health system
capacity & resilience
- Leadership & governance
- Health workforce
- Health information systems
- Essential medical products & technologies
- Service delivery
- Financing


Source: World Health Organization
Possible Solutions to Improve Neighborhood and Built Environment
- Building partnerships with community leaders to work with residents to develop violence prevention efforts
- Increase access to healthy food options by providing community gardens, mobile markets, farmers markets and healthy corner stores
- Establish neighborhood watch groups that bring communities closer together to help keep their neighborhoods safe
- Ensure all communities have access to safe green spaces at walking distance from home
- Improve the safety of homes including upgrading old appliances, removing contaminants, and making structural improvements
Summary
The social determinants of health (SDOH) have a major impact on health outcomes, especially for more vulnerable populations such as those who are uninsured or live in areas with less parks. Many of the perceptions Merced County residents have regarding the social determinants of health align with the data and offer potential explanations as to why the overall health of the community is worse than other areas in the state.
The following section, Health of the Community, will provide data to illustrate the current health status of residents of the county. This section will also highlight data on the leading causes of death, the most important health problems in the community, and other important health topics.
Using data from the next section, health agencies and partners can assess which social determinants may contribute to these health outcomes and leading causes of death; and then evaluate how to address the SDOH through an upstream, prevention-based approach, that focuses on systems and policies that can have a large impact on the whole population. For example, if many people from a specific zip code are having a higher rate of diabetes, then understanding which social determinants may impact this health outcome is important, as well as understanding how the determinants may be addressed through a prevention method – asking what policies, systems, or programs can prevent diabetes.
Economic Stability
Education Access & Quality
Social & Community Context
Healthcare Access & Quality
Neighborhood & Built Environment
Source: Healthy People 2030
Overview
The leading causes of death in Merced County can be found in the table below. The top three causes of death in Merced County for 2021 were: 1) Heart Disease, 2) COVID-19 and 3) Malignant Neoplasms (Cancer). There were 2,324 total deaths in 2021 for Merced County residents. See below for the percent of total deaths by disease/condition.
4.9%
4.6%
6.0%
4.5%
4.5%
22.6%
18.5%
14.2%
3.1%
1.9%
Cardiovascular Disease
COVID-19
Malignant Neoplasms (Cancer)
Accidents (Unintentional Injuries)
Cerebrovascular Diseases
Chronic Lower Respiratory Diseases
Diabetes
Alzheimer's Disease/
Other Degenerative Diseases
Mental Disorders due to known
Physiological Conditions
Nephritis Nephrotic Syndrome
Final Cause of Death | Rank | Total Deaths |
Cardiovascular Disease | 1
| 526
|
COVID-19 | 2
| 429
|
Malignant Neoplasms (Cancer) | 3
| 330
|
Accidents (Unintentional Injuries) | 4
| 140
|
Cerebrovascular Diseases | 5
| 115
|
Chronic Lower Respiratory Diseases | 6
| 106
|
Diabetes | 7
| 105
|
Cardiovascular Disease
First Leading Cause of Death in Merced County
Cardiovascular disease, which includes high blood pressure, heart attacks, and many other heart conditions, is recognized as a preventable cause of death. It can be managed and avoided with behavioral lifestyle changes such as eating healthy foods, exercising, not smoking, maintaining a healthy weight, and limiting stress. Although many of the risk factors for heart disease can be minimized through individual behavioral change, the risks are associated with factors outside of one’s control that are directly related to the social determinants of health (SDOH). As discussed in more detail in the SDOH chapter, issues such as having areas in Merced County where there are limited healthy food options/lack of healthy grocery stores, unsafe neighborhoods to play outside in, and even having higher than average levels of stress due to low income contribute to elevating the risk of heart disease that puts certain individuals at higher risk.
Overall, heart disease mortality rates in Merced County have decreased in recent years but are still some of the worse in the state. Over 2.1% of all emergency department (ED) visits and 12.0% of all hospital admissions in 2019 were due to heart disease (as the primary diagnosis) in Merced County.²
Merced County ranks 48th out of 58 California counties for heart disease mortality.
Heart Disease: Age-Adjusted Mortality by Location,
2011-13, 2014-16 & 2017-19
Merced County
California
United States
2011-2013
2014-2016
2017-2019
154.7
167.1
171.3
177.5
167.1

156.0
139.8
163.4
0
50
100
150
200
YEAR RANGE
143.9
RATE PER 100,000
Source: CDC WONDER Online Query System
Heart disease affects certain race/ethnicity groups disproportionally more. The death rate for heart disease for those ages 35+ in Merced County has increased substantially since 2011 for all races but has disproportionately impacted Black people at much higher rates compared to other race/ethnicity groups.
Pacific Islanders have the fastest increase in heart disease death rates since 2011, however the overall rate is much lower than Black rates.¹
Heart Diseases: Mortality Rates for Ages 35+ By Race, Merced County,
2011-13 & 2016-18
Heart Disease Death Rate for Ages 35+ By Race, 2011-2013
Heart Disease Death Rate for Ages 35+ By Race, 2016-2018
750
500
250
0
324.2
693.3
439.6
455.4
501.7
384.9
403.9
381.4
324.3
274.4
213.0
168.5
RATE PER 100,000
324.2
All Races
African American/
Black (Non-Hispanic)
White
(Non-Hispanic)
Hispanic
American Indian & Alaskan Native
Asian & Pacific Islander
RACE
Source: CDC WONDER Online Query System
Risk Factors of Heart Diseases
Non-Modifiable
Advanced
Age

Family
History

Gender
History of Heart Diseases
Modifiable
Smoking

Sedentary
Lifestyle

High
Blood Sugar

Obesity

High Cholesterol

High
Blood Pressure


Non-Modifiable- Factors you cannot change
Modifiable- Factors that you can change
Source: Ninkatec.com
The prevalence of heart disease in Merced County (7.4%) is now lower than in the United States (8.0%), after decreasing by 2.6% since 2015. Women have higher rates of heart disease (8.4%) than men (6.4%) in Merced County. Low-income adults are over 4 times more likely (11.6%) to have heart disease compared to mid/high-income adults (2.7%). In general, the rates of heart disease typically increase with age. Interestingly, heart disease is more prevalent in those 40 to 64 years of age (14.4%) than those 65 or older (11.6%) in Merced County. 70.0% of adults 65 or older suffer from high blood pressure in Merced County. Men have a higher prevalence of blood pressure than women (37.3% and 34.4%, respectively).³
Heart disease is one of the primary health issues among those who receive care or assistance from a caretaker, only behind mental illness and mobility issues.³
Merced County
Hispanic
White
Mid/High Income
Low Income
65+
40 to 64
18 to 39
Women
Men
0%
5%
10%
15%
Prevalence of Heart Disease in
Merced County, 2018
7.4%
7.6%
6.6%
2.7%
11.6%
11.6%
14.4%
0
8.4%
6.4%
PERCENT
Source: 2018 Mercy Needs Assessment
Prevalence of High Blood Pressure
in Merced County, 2018
Merced County
Hispanic
White
Mid/High Income
Low Income
65+
40 to 64
18 to 39
Women
Men
11.8%
35.8%
28.9%
44.5%
36.9%
34.5%
49.5%
34.4%
37.3%
69.7%
0%
25%
50%
75%
PERCENT
Source: 2018 Mercy Needs Assesment
The prevalence of high blood pressure among Merced County adults has decreased 1.1% since 2015, and is now 35.8%. This is 7.3% higher than the state prevalence (28.5%) and 1.2% lower than the national prevalence.³
While men have higher rates of high blood pressure than women in Merced County, women have higher rates of heart disease than men in Merced County.³
Years of Life Lost (YLL) is the number of years of life lost due to premature death. YLL is influenced by the age at which people die from the condition and the number of people that die from that condition. Diseases that kill younger people have higher YLL; diseases that kill high numbers of people also have higher YLL. For example, a child who dies in a car accident will have a higher YLL than an elderly person who dies of Alzheimer's.
Looking at the age-adjusted YLL rate per 100,000 (which adjusts for the age of the population), Black people have the highest rate, followed by Asian, White, and Latino in Merced County.⁴
Trend in Age-Adjusted YLL Rate of Heart Diseases in Merced
by Race/Ethnic Group, 2000-2002 to 2018-2020
4,000
3,000
2,000
1,000
0
Latino
Asian
Black
White
AGE-ADJUSTED YLL RATE
2000 - 2002
2003 - 2005
2006 - 2008
Source: CDPH California Community Burden of Disease Engine
2009 - 2011
2012 - 2014
2015 - 2017
2018 - 2020
YEAR RANGE
Possible Solutions to Reduce Heart Disease
129
136
118
- Provide fitness center at worksite and allow employees to use it during breaks and lunch
- Employer provided chronic disease self-management programs
- Organize community events related to physical activity and nutrition, for example a walk-a-thon
- Ensure all neighborhoods have maintained sidewalks and walking paths that are clean and safe
- Provide community garden spaces for residents to grow healthy foods
Coronavirus Disease (COVID-19)
Second Leading Cause of Death in Merced County
Merced County was one of the hardest hit counties in all of California in terms of the impact of COVID-19. The number of cases, hospitalizations, and deaths were much higher than the state averages. Part of the reason for the level of severity seen in the community was because of low vaccination rates. Merced County received the second lowest amount of doses in the state when vaccine began to roll out, which put the county at a major disadvantage early on. There are also other reasons why COVID-19 had a greater impact in this community, such as having a higher number of low-wage workers who were more likely to be considered essential workers, less options for working from home, and multi-generational crowded households.
In 2021 there were 28,126 total cases of COVID-19 in Merced County (case rate 9,841 per 100,000).¹ Inequities in COVID-19 death rates were seen in different groups. COVID-19 disproportionately impacted the elderly. The death rate for those 75 years and older is 2.3 times higher than the death rate for 65 to 74-year-olds.² When examining if there were differences by gender, 59.5% of the deaths in 2021 due to COVID-19 were in men, even though the population is roughly half male and half female.²
The total number of deaths per year in Merced County typically ranges between 1,700 and 1,800, but during COVID-19 the total deaths increased by 30.0% to 2,324 .
Merced County COVID-19 Death Rate per 100,000 by Age
RATE PER 100,000
10.0
15
10
5
0
1,122.0
0.0
0.0
33.0
220.0
483.0
0 to 4
5 to 11
12 to 17
18 to 44
45 to 64
65 to 74
75+
AGE GROUP
Source: MCDPH 2021 Death Report
The race/ethnicity most severely impacted by COVID-19, in terms of death rates, is White, followed by Asian, Black, and then the lowest rate was for Hispanic/Latino people.
To measure premature mortality due to COVID-19, years of life lost (YLL) was estimated. Men had a higher total of years of potential life lost due to COVID-19 compared to women (2,955 and 1,655 years, respectively).²
When examining death rates by city/community, Dos Palos was the city with the highest death rate, followed by Livingston. The city with the lowest death rate was Gustine.
40.9% of US adults reported delaying or avoiding medical care during the pandemic because of COVID-19 concerns.³
303,705 COVID-19 vaccine doses were administered in 2021 by Merced County providers.¹
Merced County COVID-19 Death Rate per 100,000 by Race/Ethnicity
RATE PER 100,000
200.0
2
1.5
1
0.5
0
158.0
153.0
125.0
White
Asian
Black/African American
Hispanic/Latino
Source: MCDPH 2021 Death Report
RACE
Merced County COVID-19 Death Rate per 100,000 by City
4
3
2
1
0
RATE PER 100,000
328.0
206.0
122.0
261.0
231.0
196.0
160.0
116.0
130.0
65.0
Atwater
Delhi
Dos Palos
Gustine
Hilmar
Le Grand/ Planada
Livingston
Los Banos
Merced
Winton
LOCATION
Source: MCDPH 2021 Death Report

Possible Solutions to Reduce COVID-19
- Allow employees to work from home
- If employees need to work on site, provide them with proper sanitation, enough space to practice social distancing, and ensure proper air flow circulation in buildings
- Vaccine advocacy through community partners to improve vaccination rates
- Enhanced availability of sick leave and encouragement for use of sick leave when symptomatic
Malignant Neoplasms (Cancer)
Third Leading Cause of Death in Merced County
Cancer is widely recognized as a preventable cause of death. Risk factors for preventable cancers include smoking, exposure to too much Ultraviolet (UV) radiation (for example being in the sun too much), being obese/overweight, and drinking too much alcohol. Although these risk factors can be avoided with behavioral lifestyle changes, there are some factors outside of a person’s control that can potentially put them at elevated risk, such as living around people who smoke and inhaling second hand smoke.
Merced County (153.1 per 100,000) has higher age-adjusted cancer-related mortality rates than California (134.5) and the United States (149.4).¹ Similar trends to the state and nation are seen when examining cancer mortality rates by gender, as males in Merced County have a higher age-adjusted mortality rate (176.9) compared to females (135.7). Black residents have the highest age-adjusted mortality rates (238.4), followed by White people (189.3), Asian or Pacific Islander (107.8), and Hispanic/Latino (103.7).¹
Although Merced County has higher cancer mortality rates than the state and the nation, it has lower incidence rates. Again, this can be attributed to the healthcare access issues, such as getting diagnosed much later when the cancer has already spread and become more fatal (see Healthcare Access and Quality section).

Cancer Age-Adjusted Mortality Rates, by Gender & Site, 2016-2020
200
150
100
50
0
Merced County
California
United States
128.9
117.9
176.9
177.1
157.3
Female
Male
RATE PER 100,000
135.6
GENDER
Source: CDC Wonder
The age-adjusted cancer incidence rate in Merced County is 380.5 per 100,000, 402.4 for California, and 448.6 for the United States.² The top five most diagnosed cancers in Merced County are Breast, Prostate, Lung & Bronchus, Colon & Rectum, and Kidney & Renal Pelvis cancer.²
Age-Adjusted Incidence Rates of the Top 5 Most Diagnosed Cancers by Site, 2014-2018
Merced County
California
United States
150
100
50
0
121.8
126.8
106.2
92.3
74.2
57.3
45.3
40.3
38.3
34.8
38.0
18.0
14.9
17.1
Breast
Prostate
Lung & Bronchus
Colon & Rectum
Kidney & Pelvis
RATE PER 100,000
91.8
Source: National Cancer Institute
TYPE OF CANCER
In Merced County White people have the highest age-adjusted cancer incidence rate (382.4), followed by Black (373.5), Hispanic/Latino (334.4), Asian or Pacific Islander (246.7) and American Indian or Alaskan Native (152.9).² California and the United States are similar in the race/ethnicity incidence rates in terms of the highest to lowest rate for race/ethnicities.
All of the cancer incidence rates are lower in Merced County for each race/ethnicity when compared to state and national rates with the exception that the rates are slightly higher for Hispanic/Latino people in Merced County compared to California (334.4 and 332.1, respectively).²
Black people have the highest rate of age adjusted years of life lost (YLL) due to cancer, followed by White, Latino and then Asian. The rates over time were steadily decreasing for Black people since 2009-2011, but have drastically increased since 2015-2017 whereas the rates have stayed relatively stable for other race/ethnicity groups.⁵
31.0%
of females age 35 and older with Medicare in Merced County had a mammogram in the past year
(CA: 31.0%; US: 33.0%)³
Age-Adjusted Cancer Incidence Rates per 100,000 for Race/Ethnicity, by Location, 2014-2018
Merced County
California
United States
334.4
332.1
345.0
152.9
173.6
285.8
246.7
291.2
291.1
373.5
398.4
444.9
382.4
416.5
451.0
0
100
200
300
400
500
Hispanic /Latino
American Indian/
Alaskan Native
Asian/
Pacific Islander
Black
White
RACE
Source: National Cancer Institute
RATE PER 100,000
2.9%
of surveyed residents have been diagnosed with skin cancer, compared to 3.3% in CA.⁴
Obesity

Excessive Sun Exposure
Alcohol


Lifestyle
Risk Factors of Cancer


Acceptability
Unprotected Sex
Sedentary
Lifestyle


Poor
Diet
Smoking
Source: VeryWell.com
Trend in Age-Adjusted YLL Rate of Cancer/Malignant neoplasms in Merced by Race/Ethnic Group,
2000-2002 to 2018-2020
Latino
Asian
Black
White
2,500
2,000
1,500
1,000
500
0
YEAR RANGE
2000-2002
2003-2005
2006-2008
2009-2011
2012-2014
2015-2017
2018-2020
AGE ADJUSTED YLL RATE
Source: National CDPH California Community Burden of Disease Engine

Possible Solutions
to Reduce Cancer
- Provide adequate resources for residents to obtain necessary cancer screenings and exams
- Promote cancer awareness
- Improve the availability of preventive, diagnostic and therapeutic treatments
- Employer provided coverage for smoking cessation counseling
- Ensuring protective equipment/items, such as hats and sunscreen, for individuals who spend a lot of time in the sun
Accidents
(Unintentional Injuries)
Fourth Leading Cause of Death in Merced County
Merced County’s unintentional injury age-adjusted mortality rate of 50.4 per 100,000 is higher than California (36.7) and lower than the United States (51.1).¹ Comparing these numbers to estimates from 2011-2013, the rates of unintentional injuries has increased across all three locations over time, with the smallest rate increase for Merced County (3.7 per 100,000) compared to an 8.2 rate increase for California and 11.9 for the United States.¹ Males are disproportionately affected compared to females in terms of unintentional injury death rates in Merced County, as well as at the state and national level.
1
Leading Causes of Accidental Death, Merced County, 2017-2020
32%
2.3%
11.4%
4.2%
10.6%
37.7%
1.9%
Drowning
Natural/Environmental
Other
Falls
Poisoning/Overdose
Motor Vehicle Traffic
Suffocation
Unintentional Injury Age-Adjusted Mortality by Gender & Location, 2016-2020
Merced County
California
United States
75
50
25
0
69.5
51.3
31.7
32.1
20.9
1
Male
Female
RATE PER 100,000
72.9
Source: CDC Wonder
GENDER
In terms of differences between age-adjusted unintentional injury mortality rates across race/ethnicities, Non-Hispanic Black people are the most impacted (78.7 per 100,000) in Merced County, followed closely by Non-Hispanic White (70.2), then Hispanic/Latino (42.5), and lastly Asian/Pacific Islander (28.5).¹ Data for American Indian/Alaskan Native is not available for Merced County. Similar patterns are seen in California with Non-Hispanic Black people (51.8) having the highest unintentional mortality rates followed by Non-Hispanic White (44.0).¹ However, at the national level American Indian/Alaskan Native people (56.3) and Non-Hispanic White people (56.3) have the highest rates, followed by Non-Hispanic Black (51.8).¹
The leading cause of unintentional injury death in Merced County is motor vehicle traffic crashes. Although motor vehicle mortality rates for the United States has stayed relatively steady for the past 15 years, California rates have slightly increased over this time period. Rates in Merced County seem to be on a downward trend after seeing the highest rate of motor vehicle traffic accidents mortality’s over the past 15 years in 2015-2017.¹ Even at their lowest, Merced County’s mortality rates have consistently remained higher than either California or United States rates. Currently the county’s mortality rate is 71.0% higher than California and 50.0% higher than the United States.¹ This can all be seen in the graph on the following page. 43.6% of surveyed Merced County residents agree or strongly agree that there are too many automobile accidents, which is supported by this mortality data for high rates of motor vehicle traffic accidents.²
Unintentional Injury Age-Adjusted Mortality by Race/Ethnicity, 2016-2020
Hispanic/Latino
Asian/Pacific Islander
White
Black
Merced County
California
United States
15.8
17.4
28.5
30.6
34.7
44.0
51.8
51.8
56.3
70.2
78.7
0
20
40
60
80
LOCATION
42.5
Source: CDC Wonder
RATE PER 100,000
Motor Vehicle Traffic Accidents: Age-Adjusted Mortality by Location,
2006 - 2020
Merced County
California
United States
25
20
15
10
5
0
22.3
13.5
10.8
16.2
10.5
11.4
9.5
11.4
10.0
17.1
10.8
7.8
8.1
2006-2008
2009-2011
2012-2014
2015-2017
2018-2020
RATE PER 100,000
19.5
13.5
Source: CDC Wonder
YEAR RANGE
Poisoning or noxious substances, which includes drug overdoses, is the second leading cause of accidental death in Merced County. Rates of poisoning/overdose deaths in Merced County have steadily increased in recent years and are now more than double the mortality rates from 2006-2008. Comparing current mortality rates for poisoning/overdose, Merced County (16.7) has slightly higher rates than California (16.2), but much lower mortality rates compared to the United States (22.2).¹
Poisoning/Overdose: Age-Adjusted Mortality Rate by 100,00 Location, 2006 - 2020
Merced County
California
United States
25
20
15
10
5
0
22.2
8.7
9.8
11.1
10.8
9.5
12.3
9.8
12.3
17.7
14.5
10.8
16.7
16.2
2006-2008
2009-2011
2012-2014
2015-2017
2018-2020
RATE PER 100,000
7.9
Source: CDC Wonder
YEAR RANGE
Falls are the third leading causes of accidental deaths in Merced County. All other causes of death make up less than 5% each of the total accidental deaths.

Possible Solutions
to Reduce Unintentional Injuries
- Provide defensive driving courses for community residents
- Promote distracted driving courses at high schools
- Improve road infrastructure and ensure traffic signs are visible
- Make sure sidewalks are maintained and safe to walk on (no tripping hazards)
- Provide education on the importance of keeping medications and other potentially hazardous items out of children’s reach
- Development of addiction recovery resources and drug disposal locations
- Dissemination of educational material on drug use to combat misinformation and reduce stigma
Cerebrovascular Disease (Stroke)
Fifth Leading Cause of Death in Merced County
Stroke is recognized as a preventable cause of death, which can be managed and avoided with behavioral lifestyle changes similar to those for heart disease (see Heart Disease section). Since 2008 stroke-related deaths have drastically decreased nation-, state-, and county-wide, however, the largest decrease was in Merced County (22.8%).¹ Even so, Merced County’s age-adjusted stroke mortality rates (40.9 per 100,000) are still higher than California’s (37.8) and the United States (37.6).¹
Similar to California, stroke-related deaths affect Black people disproportionally more than any other racial/ethnic group in Merced County. Interestingly, in Merced County Asian/Pacific Islander people have the second highest age-adjusted stroke mortality, while in California Asian people have the lowest stroke-related mortality. Hispanic/Latino people in Merced County have lower mortality rates from stroke compared to California, while the rates for White people is higher in Merced County compared to the state. In terms of gender, males have higher stroke related mortality rates compared to women (44.9 and 37.5, respectively).¹ The prevalence of stroke in Merced County (4.8%) is double than that of California (2.4%), however is similar to national (4.7%) estimates.²
The age-adjusted stroke death rate for Asian/Pacific Islander people in Merced County is the 4th highest rate for Asian/Pacific Islander people across all CA counties, only behind Tulare, Fresno, and San Luis Obispo County.
1
Stroke mortality rates have decreased 22.8% in Merced County since 2006-2008.
Age-Adjusted Stroke Mortality Rates by Location, 2006-2008, 2012-2014, & 2018-2020
60
40
20
0
Merced County
California
United States
43.7
43.5
41.5
34.7
36.5
40.9
37.8
37.6
2006-2008
2012-2014
2018-2020
RATE PER 100,000
Source: CDC Wonder
YEAR RANGE
Age-Adjusted Stroke Mortality Rates by Race/Ethnicity & Location, 2017-2020
60
40
20
0
Merced County
California
55.5
55.7
32.8
32.2
35.0
43.4
37.7
Black or African American
Asian/Pacific Islander
Hispanic/Latino
White
57.0
RATE PER 100,000
Source: CDC Wonder
RACE
Even though Merced County has similar prevalence to the United States, stroke-related death rates are higher in Merced County. This could indicate one of several things. Merced County residents might be experiencing more severe strokes. They may not be receiving adequate preventative care or have access issues in getting healthcare in a timely manner. As discussed in the Healthcare Access and Quality section the region has a shortage of medical providers. Even though Merced County has double the stroke prevalence of California, the age-adjusted mortality rate is 8.2% higher in Merced County. The rate of emergency department (ED) visits for a primary diagnosis of stroke in Merced County (2.6 per 1,000 ED visits) is higher than in California (1.78). However, the hospital admissions rate in Merced County (21.2 per 1,000 hospital admissions) is lower than the state (24.4).³ This could indicate when a resident does have a stroke they are taken to the ED, however, the severity of the stroke may be greater and fatal as this could potentially explain why hospital admission rates for stroke are lower than the state’s.
Merced County has higher Emergency Department rates for stroke than the state, but lower rates of hospital admissions.

Obesity

Lack of
Exercise
Risk factors for
STROKE


High Blood
Pressure

Sleep Apnea

High Cholesterol


Heavy Alcohol
Use

Cardiovascular
Disease


Smoking and/or
Drug Use

Diabetes
Source: Cardiac Wellness Institute
The age-adjusted stroke mortality rate for Asian people is 69.8% higher in Merced County than CA.¹
Looking at the age-adjusted years of life lost (YLL) rate per 100,000 for stroke (adjusted for the age structure of the population), Black people have the highest rate, followed by Asian, Latino and White in Merced County. This suggests that Black people have lost the most years of life prematurely from stroke, resulting from a high number of deaths at a younger age compared to other race/ethnicity groups. This trend continues to increase at a much faster rate compared to other race/ethnic groups. Asian people have also seen an increase in recent years, but at a much lower rate compared to Black people.⁴
Trend in Age-Adjusted YLL Rate of Stroke in Merced by Race/Ethnicity,
2000-2002 to 2018-2020
AGE-ADJUSTED YLL RATE
Latino
Asian
Black
White
750
500
250
0
2000-2002
2003-2005
2006-2008
2009-2011
2012-2014
2015-2017
2018-2020
YEAR RANGE
Source: CDPH California Community Burden of Disease Engine

Possible Solutions
to Reduce Stroke
- Employer provided blood pressure measuring station for frequent self-monitoring
- Organize culturally tailored healthy cooking classes for community members
- Employer sponsored physical activity incentive programs
- Ensure accessibility to safe parks and playgrounds in all communities
- Employer sponsored smoking cessation counseling
- Provide space for community gardens for residents to grow healthy foods
- Reduce chronic toxic stress
Chronic Lower Respiratory Disease
Sixth Leading Cause of Death in Merced County
Chronic lower respiratory diseases are recognized as a preventable cause of death. Cigarette smoking is a major cause of these illnesses, accounting for about 80.0% of cases. However, exposure to air pollutants at home and in the workplace, genetic factors and respiratory infections can also play a role in the development of chronic lower respiratory disease.¹ This chapter includes asthma, chronic obstructive pulmonary disease (COPD), pneumonia and influenza.
Age-Adjusted Chronic Lower Respiratory Mortality Rates by Location,
2006-2008, 2012-2014 & 2018-2020
50
40
30
20
10
0
Merced County
California
United States
42.4
39.4
42.2
41.4
33.9
39.4
38.1
29.3
2006-2008
2012-2014
2018-2020
48.8
RATE PER 100,000
Source: CDC Wonder
YEAR RANGE
2.4% of all emergency department visits and 2.0% of hospital admissions in Merced County in 2019 were due to a primary diagnosis of chronic lower respiratory diseases (compared to 2.0% and 1.5% for California, respectively).² Deaths due to chronic lower respiratory disease have decreased over time in Merced County, which is similar to California and the United States. The age-adjusted mortality rate due to chronic lower respiratory disease remains higher in Merced County compared to state and national rates. Since 2006-2008 Merced County has seen a 19.3% decrease in age-adjusted death rates of chronic lower respiratory disease, which is a greater reduction than the United States during this same time period (10.1%). However, California mortality rates decreased about 25.6% since 2006-2008. Merced County’s pneumonia and influenza age-adjusted death rates (18.3 per 100,000) is about 34.6% higher than the death rate for California (13.8) and the United States (13.4).³
The prevalence of COPD in Merced County (8.3%) is similar to national estimates (8.6%). However, the prevalence in Merced County is nearly double of the state’s (4.4%).⁴ The prevalence of asthma in Merced County is higher than the rate in California. However, the prevalence of asthma is lower in children (ages 0-17) in Merced County compared to California, but higher in those 18 years and older. There is an 11.0% difference in the prevalence of asthma between children and adults in Merced County compared to only a 4.2% difference for the state.⁵ One explanation as to why the prevalence of asthma is much higher in adults than children in Merced County could be because of elevated health risks due to continuous exposure to poor air quality. As discussed in the social determinants of health (SDOH) chapter, air quality has a major influence on health. Similar to the rest of counties in the San Joaquin Valley, Merced County experiences much poorer air quality than the rest of the state because of the geographical nature of the Valley - pollution from the state enters and stays in the Valley basin. The chronically bad air quality, over time, can lead to more respiratory issues because of the long-term exposure to poor air quality.
Percentage Ever Diagnosed with Asthma by Age Group, 2019-2020
Merced County
California
All Ages
Adults (18+)
Children (0-17)
15.1%
16.2%
11.0%
11.9%
22.0%
0%
5%
10%
15%
20%
25%
AGE GROUP
18.9%
Source: CDPH CA Asthma Dashboard
PERCENT
47.4% of surveyed Merced County residents, who have been told by a doctor they have asthma, have had an asthma episode or attack in the past year while 50.9% are taking medication daily to control their asthma.⁶ Rates of emergency department visits for asthma are much higher in Merced County compared to California. In terms of differences in asthma emergency department (ED) visits by race/ethnicity, all racial and ethnic groups have higher rates in Merced County than California. Black people have the highest ED visit rates in Merced County and have a 3.3 times higher rate than White, which is the next highest group.⁵ Higher rates of asthma ED visits suggest that asthma is poorly managed in the county as a whole, and particularly in the Black population. There could be several potential reasons why asthma is poorly managed, such as having a shortage of primary care providers in the county, a lack of insurance to cover medications, or just a lack of resources due to having low-income.
Asthma Emergency Department visit rates in Merced County, by age or race/ethnicity (2019)
Group
Merced County
California
All Ages
0-17 years
18+ years
0-4 years
5-17 years
18-64 years
65+ years
Asian
Black
Hispanic
Multi-race
White
42.6
59.4
63.4
48.2
35.4
38.1
21.6
22.1
20.6
17.1
58.4
53.7
91.6
77.0
85.9
107.1
56.2
42.3
24.4
17.2
61.5
30.1
153.2
204.0
0
50
100
150
200
250
Comparison
Total Population
Children vs. Adults
Age Group
Race/Ethnicity
Source: CDPH CA Asthma Dashboard
RATE PER 10,000
Similar to patterns in other diseases, higher emergency department (ED) rates suggest people are not using primary care and are using the ED for their primary care instead. Interestingly, 72.1% of all asthma ED visits in Merced County are insured through Medi-Cal (compared to 15.5% for private insurance), while 53.7% of all asthma hospitalizations in Merced County residents have Medi-Cal (compared to 26.8% for private insurance).
This aligns with research showing that ED visits increased after the Medi-Cal expansion because patients do not have to fear debt collection, visiting the ED is more convenient than going to a regular doctor’s office visit, even though it is much more costly to Medi-Cal, and patients don’t have to worry about finding doctors who accept their insurance.⁷
Merced County ranks in the top 10 California counties for highest emergency department asthma visit rates.⁵
Merced County ranks in the top 15 California counties for highest hospitalization rates for asthma.⁵
Asthma is one of the most common chronic diseases in children.⁸

Possible Solutions to Reduce Chronic Lower Respiratory Disease
- Provide incentives for cleaner burning alternatives to wood burning stoves
- Ecological forest restoration along with controlled burns to reduce the risk of mega fires
- Create more green spaces to help remove pollutants
- Provide face masks and respirators at worksites and schools
- Ensure accessibility to flu and pneumonia vaccine during winter seasons to prevent severe disease
- Organize biannual proper inhaler use classes in the community
- Ensure all homes have proper ventilation for healthy indoor air quality
Diabetes Mellitus
Seventh Leading Cause of Death in Merced County
Diabetes is recognized as a preventable cause of death, which can be managed and avoided with behavioral lifestyle changes. Modifiable risk factors for diabetes include being overweight/obese, having prediabetes, not being physically active, poor diet, and smoking. 0.8% of all emergency department visits and 2.4% of hospital admissions in Merced County in 2019 were due to a primary diagnosis of diabetes (compared to 0.8% and 1.8% for California, respectively).¹ The ED visit and hospital admissions rate for a primary diagnosis of diabetes is lower in Merced County than the state. Black people (6.5 per 1,000) have the highest rate of emergency department visits due to diabetes in Merced County, followed by Native Hawaiian/ Other Pacific Islander people (3.6), Hispanic/Latino (3.3), White (3.2) and Asian (1.1). For diabetes hospital admission rates, Blacks (4.2 per 1,000) have the highest rate, followed by White (3.2), Native Hawaiian/Other Pacific Islander (2.7), Hispanic/Latino (2.1), and Asian (0.8).¹
Merced County has the highest diabetes age-adjusted death rate in the San Joaquin Valley and is the 5th highest county in California.²
69.4%
of those with diabetes in Merced County take insulin or other medications to treat their diabetes and 52.3% have had their blood sugar tested in the past 3 years.³
Though Merced County prevalence of diabetes is comparable to both the state and United States, the county's prevalence of "pre-diabetes" is 265.0% higher than the state prevalence and 53.7% higher than the United States prevalence.³
Emergency Department Visit and Hospital Admission Rates for People with Diabetes, 2019
30
20
10
0
26.0
7.5
Merced ED Visits
CA ED Visits
Merced Hospital Admissions
CA Hospital Admissions
RATE PER 1,000
20.1
13.1
Source: OSHPD 2019
The age-adjusted prevalence of diabetes, for adults age 20+, in Merced County (8.9%) is higher than the state (8.7%) but lower than national (9.0%) estimates.⁴ Although diabetes prevalence is similar across all three locations, Merced County is on a downward trend after its most recent peak in 2015 while prevalence for California and the United States is slightly increasing. Prevalence of diabetes in adults is higher in males (9.3%) compared to females (8.5%) in Merced County, which is the same pattern seen in California and the United States.⁴ Looking at diabetes in the entire Merced County population, 15.9% of residents have been diagnosed (10.2% California, 13.3% United States). 14.6% of Merced County residents have borderline/pre-diabetes, which is higher than state (4.0%) and national (9.5%) estimates.⁵
Diabetes Prevalence in Adults (20+) by Location, 2007-2019
PERCENT
YEAR
Merced County
California
United States
15%
10%
5%
0%
2007
2011
2015
2019
Source: CDC
Merced County diabetes death rates have increased over time, and are higher than both state and national rates. Both California and United States age-adjusted diabetes death rates have remained stable, however Merced County rates have risen 19.3% in the last 12 years.² This indicates that diabetes is not well controlled locally.
Age-Adjusted Diabetes Mortality Rates by Location, 2006-2008, 2012-2014 & 2018-2020
40
30
20
10
0
Merced County
California
United States
22.0
22.8
28.1
20.5
21.1
32.2
22.9
22.6
2006-2008
2012-2014
2018-2020
RATE PER 100,000
27.0
Source: CDC Wonder
YEAR RANGE
As previously mentioned, emergency department (ED) visit and hospitalization rates due to diabetes are lower in Merced County compared to the state. However, there are higher prevalence and mortality rates in Merced County. One possible explanation could be that there is a high percent of uncontrolled cases of diabetes in Merced County, which can be due to lack of access to regular health care, or the high cost of insulin. According to a survey of Merced County residents, 97.7% of those who have been diagnosed with diabetes are somewhat confident or very confident they are able to control and manage their diabetes.⁶ Majority of those with diabetes are confident they are able to take care of their diabetes, but prevalence and mortality rates in Merced County are higher. This suggests there could be social determinants of health (SDOH) factors involved. A lack of regular primary care and barriers to access medical services could be keeping people with diabetes from using health care services to control their diabetes until they can no longer control it and end up in the hospital with a severe case that may result in death.

Possible Solutions to Reduce Diabetes
- Provide fitness centers at worksite and allow employees to use it during breaks and lunch
- Employer provided diabetes prevention programs
- Organize community events related to physical activity and nutrition, for example a walk-a-thon
- Ensure all neighborhoods have maintained sidewalks and walking paths that are clean and safe
- Provide space for community gardens for residents to grow healthy foods
- Provide glucose meters for prediabetes for self-management
- Ensure vending machine snack & beverage choices in the workplace are healthy
- Create outdoor workout spaces, such as an asphalt track at every park or fitness zone
- Organize companywide fitness competitions with a fitness app such as WalkerTracker
Overview
Merced County Department of Public Health conducted a survey of Merced County residents from December 2021 to April 2022.¹ Respondents were asked what they believe the most important health problems are in their community. The most important health problem was COVID-19, followed by aging and mental health issues.
Health Problems | Rank | Percentage of respondents who believe the health problem is important or very important |
COVID-19 or other infectious/contagious diseases | 1
| 49.3% |
Aging issues such as Alzheimer's disease, hearing loss, memory loss or arthritis | 2
| 44.8% |
Mental health issues such as depression, hopelessness, anger, etc. | 3
| 44.7% |
HIV/AIDS and other STIs* | 4
| 44.3% |
Cerebrovascular diseases (Stroke)** | 5
| 43.4% |
Oral Health | 6
| 43.3% |
Malignant Neoplasms (Cancer)** | 7
| 43.2% |
*HIV/AIDS and other sexually transmitted infections (STIs) can be found in the COVID-19 or Other Infectious/Contagious Diseases sections.
**Cerebrovascular diseases (stroke) and Malignant Neoplasms (Cancer) can be found in the Leading Causes of Death chapter.
Other Infectious/Contagious Diseases
The Most Important Health Problem
Since there is a separate chapter on COVID-19 in the Leading Causes of Death section, this chapter will focus on other infectious and contagious diseases, specifically: Influenza, Tuberculosis, Arboviruses, Valley Fever, Hepatitis, HIV/AIDS, Chlamydia, Gonorrhea, and Syphilis. With the advent of immunizations, infectious diseases are typically not the primary causes of death they were a century ago. However, COVID-19 caused an alarming number of deaths worldwide and reminded people that infectious diseases are still an important public health concern.
Influenza
Merced County has not been heavily impacted by flu deaths or non-fatal ICU hospitalization cases for those between 0-64 years old. From 2018-2021, Merced County reported 5 deaths and 25 ICU cases.¹
The percent of Merced County residents (Medicare enrollees) that had their annual flu vaccination is similar to California (42.0% and 43.0%, respectively).² Black people have the lowest flu vaccinations rate, while Asian and White people have the highest.
Percentage of Fee-For-Service Medicare Enrollees That Had an Annual Flu Vaccination, Merced County 2019
40%
20%
50%
30%
10%
Black/African American
0%
33.0%
Hispanic/Latino
45.0%
Asian
45.0%
White
American Indian/Alaskan Native
40.0%
42.0%
Overall
PERCENT
38.0%
RACE
Source: County Health Rankings & Roadmaps
Tuberculosis
In 2012, Merced County had the 7th highest rate of tuberculosis in the state (7.2 per 100,000 population). The TB rate in 2021 (3.2 per 100,000) is less than half of the rate in 2012 and Merced County now has the 19th highest rate in the California.³ Although the TB rate in Merced County is lower than in CA (4.4 per 100,000), the rates are still higher than in the US (2.4 per 100,000).³
Arboviruses
Merced County has relatively low levels of West Nile Virus, with 35 cases being reported from 2018-2021.¹
Coccidiodomycosis (Valley Fever)
Valley Fever is a lung infection caused by the fungus, Coccidiodes, characterized by respiratory and influenza-like symptoms. Rates of Valley Fever have decreased in the last couple of years, after recently peaking in 2018. Valley Fever is very common in the San Joaquin Valley, especially further south, such as in Madera and Fresno counties.
Coccidiodomycosis (Valley Fever) Rate, Merced County, 2015-2021
80
60
40
20
0
75.2
45.8
36.9
46.2
35.8
34.6
2015
2016
2017
2018
2019
2020
2021
RATE PER 100,000
36.5
YEAR
Source: Local MCDPH Surveillance Data
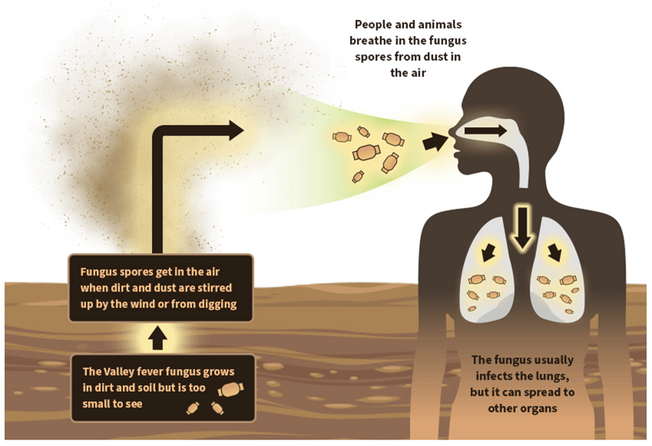
Source: CDPH
Hepatitis
Hepatitis C is one of the most frequently reported communicable diseases in Merced County. Rates of Hepatitis B in 2021 had decreased 89.6% since 2015. Hepatitis C rates have also decreased since 2015. Merced County has high rates of liver disease mortality (see Mental Health/Substance Abuse section).
Hepatitis B & C Rates, Merced County, 2015-2021
Hepatitis C
Hepatitis B
150
100
50
0
23.1
24.0
14.2
4.7
13.5
10.9
2.4
2015
2016
2017
2018
2019
2020
2021
RATE PER 100,000
124.6
130.3
138.5
132.8
136.4
113.8
103.9
Source: Local MCDPH Surveillance Data
YEAR
HIV/AIDS was identified as the fourth most important health problem. This section, will also include other sexually transmitted infections (STIs), such as Chlamydia, Gonorrhea, and Syphilis.
Human Immunodeficiency Virus/ Acquired Immunodeficiency Syndrome (HIV/AIDs)
HIV/AIDs age-adjusted mortality rates are higher in Merced County (2.0 per 100,000) than California (1.4) and the United States (1.5).¹ The number of people living with HIV/AIDs in Merced County is 107.9 per 100,000. Hispanics have a lower rate of people living with HIV/AIDs in Merced County than White people (124.2 and 145.7, respectively). The rate, per 100,000, of new HIV/AIDs diagnosis in Merced County is 10.0, while the rate for Hispanic people is 13.7 and 12.4 for White people.² 32.2% of Merced County adults have tested for HIV before, which is lower than the percentage for California (36.7%).³
HIV/AIDS New Cases, Merced County, 2017-2021
NUMBER OF CASES
25
35
20
31
31
40
30
20
10
0
2017
2018
2019
2020
2021
Source: Local MCDPH Surveillance Data
YEAR
Chlamydia
Chlamydia is the second most reportable disease in Merced County, only behind COVID-19. Rates have been decreasing since 2019 and are currently at a 4-year low.
Chlamydia and Gonorrhea Rates, Merced County, 2018-2021
RATE PER 100,000
YEAR
600
400
200
0
Chlamydia
Gonorrhea
584.9
578.2
171.3
244.7
440.0
226.2
390.1
172.5
2018
2019
2020
2021
Source: Local MCDPH Surveillance Data
Gonorrhea
Gonorrhea is the third most prevalent reported disease in Merced County. Current rates are down and similar to rates from 2018, after seeing a couple years of increased rates.
Syphilis
Rates of syphilis have remained fairly stable the last 4 years. Syphilis rates continue to be higher in men compared to women in Merced County. Syphilis in women is of concern because of the increased possibility of congenital syphilis, a devastating infection in fetuses that can lead to stillbirth, miscarriage, or birth defects that can affect the skeleton, face, central nervous system, skin, teeth, and/or ears.⁵ Health disparities exist when examining syphilis rates in race/ethnicity for Merced County. African American/Black people have the highest rate and are 1.8 times higher than the next highest race/ethnicity (Hispanic/Latino).⁴
Some of the recent decreases in communicable diseases, for those primarily spread through close contact with an infected person, can possibly be attributed to the COVID-19 pandemic and the lockdowns. People were forced to stay home and were less social, resulting in lower exposure to these infectious diseases.
Syphilis Rates by Gender & Race/Ethnicity, Merced County, 2021
Male
Female
White
Black/African American
Asian
Hispanic/Latino
Data suppressed
112.3
0
25
50
75
100
125
RACE
96.1
85.7
47.9
112.3
64.4
Source: MCDPH Surveillance Data
RATE PER 100,000
SAFER SEX

LIMIT
PARTNERS

GET
TESTED


TALK TO
PARTNERS

EDUCATE
YOURSELF
AVOID
DRUGS/ALCOHOL
Source: Amaze.com: STIs by jekuhn
2 out of 5 surveyed Merced County residents agree or strongly agree that people in the community practice risky sexual behaviors, such as unprotected sex or sexual activity before 18.
6
Unique Factors Place Youth at Risk for STIs


Insufficient Screening
Many young women don't receive the chlamydia screening CDC recommends
Confidentiality Concerns
Many are reluctant to disclose risk behaviors to doctors
Source: Utah Department of Health
Biology
Young women's bodies are biologically more susceptible to STIs
Lack of Access to Healthcare
Youth often lack insurance or transportation needed to access prevention services
Multiple Sex Partners
Many young people have multiple partners, which increases STI risk

Possible Solutions to Reduce Infectious Diseases
- Ensure public schools are teaching updated comprehensive sexual education & HIV prevention education
- Provide free condoms at the local colleges and at community health centers
- Promote and ensure accessibility to STI testing, inclusive of rapid and at home testing, and treatment
- Organize back to school vaccine clinics that offer vaccines such as HPV, Flu, TB, Hep B, etc.
- Increase awareness & accessibility to Syringe Service Programs (Syringe Exchange)
- Provide face masks at worksites and schools
- Increase access to Pre-Exposure Prophylactics (PrEP) and Post-Exposure Prophylactics (PEP) for people at risk for HIV/AIDS
Aging Population
Second Most Important Health Problem
Merced County has a fairly young population, with a median age of 31.1 years, much younger than that of California (36.5) and the United States (38.1).¹ The median age is slowly increasing across all three locations, as the older adult population continues to grow. 11.0% of the population in Merced County is 65 or older, compared to 14.0% for the state and 15.6% for the United States0.¹ Despite having a relatively young population, ailments that predominantly affect the senior population are still a concern in the county. For example, Alzheimer’s Disease is the 8th leading cause of death in Merced County.²
The 65+ population is not evenly dispersed across the county, as there are certain census tracts that have higher proportions of older adults. There are no census tracts in Merced County where there is over 20.0% of the population being 65 or older.
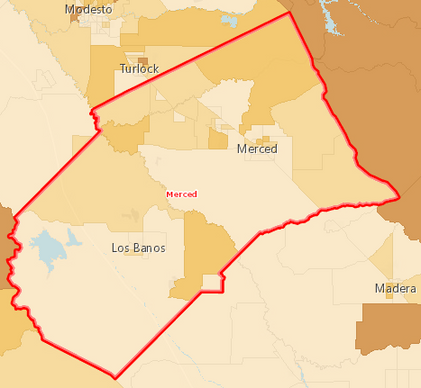
Population Age 65+, Percent by Tract, ACS 2015-19
Over 20.0%
16.1 - 20.0%
12.1 - 16.0%
Under 12.1%
No Data or Data Suppressed
Merced County, CA
44.9%
of the population ages 65+ in the county report having a disability, which is 10.4% higher than both California and the United States.¹
Merced County has lower age-adjusted Alzheimer’s mortality rates (28.5 per 100,000) than California (38.2) and the United States (31.0). Since 2006-2008 Alzheimer’s death rates have increased across all three locations. However, California has the largest increase over this period of time (42.0%) followed closely by Merced County (41.8%), while the United States has increased 27.0%.³
Merced County has lower Alzheimer's age-adjusted death rates than California and the United States.
Arthritis is the leading cause of work disability in the United States.⁴ California has a lower prevalence of arthritis among adults compared to the United States (22.4% and 28.2%, respectively) and is one of the states with the lowest prevalence. Merced County (19.9%) has lower prevalence of arthritis than the state and nation and ranks in the top 15 California counties for lowest prevalence.⁵
Age-Adjusted Alzheimer's Mortality Rates by Location,
2006-2008, 2012-2014 & 2018-2020
40
30
20
10
0
Merced County
California
United States
26.9
24.4
30.3
26.7
24.3
38.2
28.5
31.0
2006-2008
2012-2014
2018-2020
RATE PER 100,000
20.1
Source: CDC Wonder
YEAR RANGE
Model-Based Prevalence of Arthritis Among Adults, by County, 2015
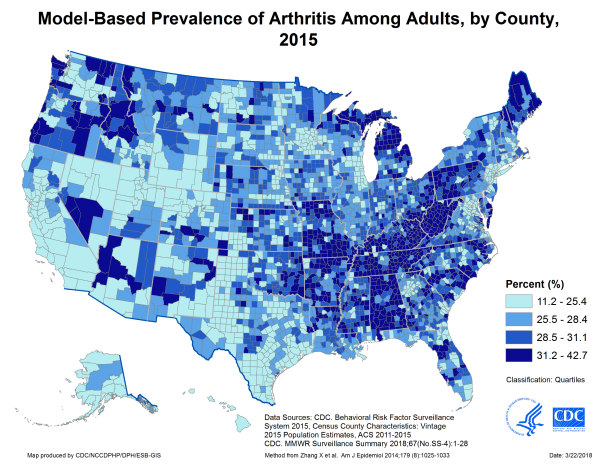

Possible Solutions to Reduce Aging Related Issues
- Offer mobile screening services that come to older adult homes
- Offer meals on wheels or other mobile healthy food services
- Provide free or low-cost transportation to healthcare appointments
- Policies that support social engagement of older adults
Mental Health & Substance Use
Third Most Important Health Problem
Depression is a mental health condition that, left untreated, can lead to physical health problems, loss of productivity and suicide. 16.7% of adults in Merced County have been diagnosed by a physician as having a depressive disorder (California 13.4%, US 21.6%).¹ For every 1,000 emergency department (ED) visits in Merced County, 9.4 are due to a primary diagnosis of depression or anxiety. 13.0 per 1,000 hospital admissions in Merced County are because of depression or anxiety (California 18.7).² Though the prevalence of depression is higher in Merced County compared to the state, there is less hospital usage for both admissions and emergency department visits for depression. This could potentially be a healthcare access problem (discussed in more detail in the Healthcare Access and Quality section).
13.1%
of Medicare beneficiaries in Merced County have depression, which is lower than both state (16.2%) and national (18.0%) levels.³
Just above 32.0% of Merced County adults have had two or more years in their lives when they felt depressed or sad on most days but had some days where they felt okay, which is a symptom of chronic depression. When it comes to chronic depression, more low-income adults experience symptoms of chronic depression than mid/high income adults. Nearly 2 in 5 low-income adults, compared to 1 in 4 mid/high income adults have experienced chronic depression.
The Social Determinants of Mental Health
under employment/
unemployment
adverse childhood experiences
food insecurity

Poor Mental Health and
Risk of Mental Illness
housing instability
poor access to and quality of health care
social exclusion/
social isolation
low education/
educational inequality
poor neighborhoods/
built environments
poverty/low income/
income inequality
Source: Mental Health America of Eastern Missouri
In terms of gender, more females experience symptoms of chronic depression compared to males. About 9.6% of adults in Merced County consider their typical day to be extremely or very stressful, while 40.6% consider their typical day to be moderately stressful. 20.5% of surveyed Merced County residents have had serious psychological distress during the past year.²
Suicide mortality in Merced County (9.2 per 100,000) has slightly decreased in recent years and the rates are lower than both the state (10.5) and US (13.9).⁴ Suicide mortality is higher among males than females in Merced County, California and the United States.
In Merced County male death rates due to suicide, are nearly 3 times higher than female death rates.⁴
27.0% of Merced County adults have sought professional help for an emotional or mental health problem and 11.3% are currently taking medication or receiving treatment from a doctor/health professional for an emotional or mental health related condition.¹
The COVID-19 pandemic increased the prevalence of anxiety and depression 25.0% worldwide.⁶
Age-Adjusted Suicide Mortality Rates by Location, 2006-2008, 2012-2014 & 2018-2020
15
5
0
Merced County
United States
11.3
9.9
12.7
10.3
13.9
9.2
10.5
2006-2008
2012-2014
2018-2020
RATE PER 100,000
7.8
9.5
YEAR RANGE
Source: CDC Wonder
Merced County Adults Who Have Experienced Symptoms of Chronic Depression
40%
30%
20%
10%
0%
39.4%
32.7%
38.1%
37.4%
37.0%
30.8%
26.7%
24.2%
Men
Women
18-39
40-64
65+
Low Income
Mid/High Income
White
Hispanic
PERCENT
27.3%
Source: 2018 Mercy Needs Assessment
COVID-19's Widespread Impact on Mental Health
(Share of adults who experienced stress, anxiety or sadness
that was difficult to cope with alone during the pandemic)
United States
Canada
United Kingdom
France
Australia
New Zealand
Sweden
Netherlands
Norway
26.0%
26.0%
24.0%
23.0%
23.0%
18.0%
14.0%
10.0%
0%
10%
20%
30%
40%

COUNTRY


33.0%
n=8,259 (February to June 2020)
Source: The Commonwealth Fund
47%
of Merced County residents agree or strongly agree that people in the community suffer from poor mental health.⁶
Substance Use
Substance use is a mental health condition that, left untreated, can lead to physical health problems, loss of productivity, and suicide. Drug-induced age-adjusted mortality rates are lower in Merced County than the United States, and are similar to California rates. Since 2009-2011, drug-induced mortality rates have increased 42.7% in Merced County, which is much lower than the rate of increase in California (56.6%) and the United States (88.5%). Excessive substance use can lead to physical health problems, including cirrhosis and liver disease. Cirrhosis/liver disease age-adjusted mortality rates have steadily increased since 2009-2011 and continue to be higher in Merced County compared to the state and nation. Even though rates are highest in Merced County, the rate in the United States has increased much more drastically (15.6% and 26.6%, respectively) in comparison.¹
Just under half of surveyed Merced County residents agree or strongly agree that drug abuse is a problem in the community and 44.1% agree or strongly agree that it is easy to obtain drugs, alcohol, or tobacco products.²
Merced County adults report lower levels of heavy alcohol consumption (17.0%) than the United States (19.2%) or California (18.1%) population, despite having higher age-adjusted mortality rates due to cirrhosis/liver disease.³ Excessive drinking, defined as at least one binge drinking session in the last 30 days, or an average of two or more drinks per day for males or one or more drinks per day for females, is reported more by males, residents ages 18 to 39, residents with mid to high income, and Hispanic adults.⁴ A survey of community members found that 57.0% agree or strongly agree that alcohol abuse is a problem in the community.²
Drug-Induced Deaths: Age-Adjusted Mortality Rates by Location, 2009-2020
Merced County
California
United States
2018-2020
2015-2017
2012-2014
2009-2011
17.7
17.7
12.4
15.9
11.6
14.2
14.6
11.3
12.4
13.1
20.3
24.7
0
5
10
15
20
25
YEAR RANGE
Source CDC Wonder
RATE PER 100,000
Merced County has higher age-adjusted alcohol induced mortality rates than California and the nation (12.9 per 100k, 12.7, and 11.2, respectively).¹
Age-Adjusted Mortality Rates Due to Cirrhosis/Liver Disease by Location, 2009-2020
Merced County
California
United States
20
15
10
5
0
12.8
11.9
2009-2011
2012-2014
2015-2017
2018-2020
RATE PER 100,000
14.7
11.5
9.4
16.1
11.8
10.2
15.8
12.3
10.8
17.0
Source: CDC Wonder
YEAR RANGE
Excessive Drinking Prevalence By Sex, Age, Income & Ethnicity,
Merced County, 2018
25%
20%
15%
10%
5%
0%
21.5%
17.7%
17.8%
11.8%
11.9%
10.8%
8.2%
4.6%
Men
Women
18-39
40-64
65+
Low Income
Mid/High Income
White
Hispanic
PERCENT
21.0%
Source: 2018 Mercy Needs Assessment
Merced County has a higher percentage of adults who are current smokers compared to the state (14.0% and 10.0%, respectively).⁵ Smoking is a risk factor associated with increased risk of several of the top causes of death in Merced County. Smoking also endangers people around the smoker through exposure to secondhand smoke. 18.5% of adults reported being exposed to secondhand smoke or electronic cigarette (e-cig) vapor in the past two weeks.
E-cigs are popular in kids, teens and young adults as they are more attracted to the variety of flavors available. Most e-cigs contain nicotine which make them unsafe. However, marijuana use in this age group is more popular, especially in high school students. E-cig and marijuana use in 7th, 9th and 11th graders in Merced County is lower than California.⁷
Disparities exist in age-adjusted drug-induced mortality rates in Merced County, as White people have a 2.6 times higher mortality rate compared to Hispanic/Latino people (34.5 and 12.6 per 100k, respectively).¹
Half of surveyed Merced County residents agree or strongly agree that smoking (electronic cigarettes, vaping, cannabis, menthol, and hookahs) is a major health concern in the community.
Percent of Students That Have Used E-Cigs on 7 or More Occasions in Their Lifetimes, by Location, 2017-2019
15%
10%
5%
0%
Merced County
California
2.1%
5.4%
6.3%
8.6%
11.5%
Grade 7
Grade 9
Grade 11
PERCENT
1.7%
GRADE LEVEL
Source: kidsdata.org
Percent of Students That Have Used Marijuana on 7 or More Occasions in Their Lifetimes, by Location 2017-2019
20%
15%
10%
5%
0%
Merced County
California
14.5%
15.2%
6.6%
7.3%
1.7%
Grade 7
Grade 9
Grade 11
PERCENT
1.6%
Source: kidsdata.org
GRADE LEVEL
Risk Factors for Substance Abuse

Family history of
addiction
Socio-economic
deprivation

Homelessness


There are strong links between health inequalities and drug use but the picture is complex


Poor mental health is linked to drug misuse and vis versa
Unemployment, poor working conditions and job insecurity
Men are more likely to use illegal drugs
Source: Gov.uk

Possible Solutions to Improve Mental Health & Lower Substance Abuse
- Increase knowledge around the importance of mental health in schools
- Provide mental health training to primary care providers
- Provide more resources for schools to help students who are struggling with mental health
- Provide mental health screenings in schools
- Promote local suicide hotline
- Increase promotion of available counseling services in the community
- Provide transportation for mental health services
Oral Health
Fourth Most Important Health Problem
Oral health is closely linked to your overall health. Research has found that having dental insurance can positively impact oral health outcomes.¹ People who have dental insurance were found to visit the dentist more frequently and reported very good or excellent oral health. The percentage of Merced County adults with dental insurance has increased in recent years, however is still below the state percentage.²
As more people have dental insurance, we would expect the rate of emergency department visits for non-traumatic dental conditions to decrease. This is seen at the state level, however, as dental insurance coverage has increased so has total emergency department (ED) rates for dental conditions in Merced County. This could be an access issue, potentially related to the inability of residents to take paid time off of work to visit their dentist or even because there are a limited number of providers that actively accept Medi-Cal.
Emergency Department Rates for Non-Traumatic Dental Conditions by Race/Ethnicity, 2017-2019
Merced County
California
1,250
1,000
750
500
250
0
1191.3
446.5
473.4
665.8
611.0
642.3
485.3
248.5
330.7
359.8
62.5
Asian
Other
African American
White
Hispanic
Total
RATE PER 100,000
119.8
RACE
Source: Reno, NV Associate of State & Territorial Dental Directors
The ED rates for non-traumatic dental conditions, in Merced County, for White people decreased the most (32.5%) from 2014-2016 to 2017-2019, followed by Other (23.7%), African American (22.5%), and Asian people (5.5%). For Hispanic people, the rates increased by 2.3% over this same period of time.³
As discussed in the Healthcare Access and Quality section, Merced County has a shortage of healthcare providers, and dentists are no exception. In Merced County, the ratio of population to dentists is the 8th worst in the state (2,150 residents for 1 dentist). In California the ratio is 1,130 population for 1 dentist.⁴ Good oral health starts early. Cavities are one of the most common chronic childhood disease in the United States.⁵ The good news is that it is preventable. Poor oral health can cause speech development problems in children, increase school absenteeism, affect nutrition intake and quality of life in both children and adults. It is especially important to make sure children have access to dentists. 6.8% of children ages 2-11 in Merced County have never had a dental visit.⁶
Heart
Disease
Mouth
Cancer
Mouth
Cancer
Lung
Conditions
Diabetes


Dental
Decay
Gum
Disease


Tooth
Loss
Bad
Breath
Source: Overland Park Dentistry
Poor oral health can cause speech development problems in children, increase school absenteeism, affect nutrition intake and quality of life in both children and adults.
The condition of teeth in Merced County, for adults, is worse than for California. 10.5% of adults in Merced County describe the condition of their teeth as excellent (California 11.6%), 17.9% as very good (California 28.4%), 22.4% as fair (California 19.2%) and 10.4% as poor (California 6.5%).² More detailed oral health data can be found in the Oral Health Needs Assessment.
Oral health is closely linked to your overall health. Research has found that having dental insurance can positively impact oral health outcomes.

Possible Solutions to Improve
Oral Health
- Increase the number of dentists and dental clinics throughout Merced County
- Paid Time Off (PTO) policy changes
- Provide transportation services to and from medical appointment
- Identify and support trusted partners in assisting with Medi-Cal enrollment in areas with high uninsured rates
- Increase outreach and enrollment for medi-cal
Pregnancy and Birth
Pregnancy, Birth Outcomes and Breastfeeding
Early quality care is essential for the best start to life. Having a healthy pregnancy is one of the best ways to promote a healthy birth. By getting early and regular prenatal care, the chances of a healthy pregnancy are greatly improved, which can be seen in prenatal and birth outcomes.
Merced County consistently has higher rates of births than California and the United States, which contributes to Merced County’s young median age. Across all three locations, birth rates have generally decreased since 2016.
Merced County has the 5th highest birth rate in the state, and has a 25% higher birth rate than the state average.
Many of the births in Merced County are teen pregnancies (26.3 per 1,000), which is much higher than in California (15.7).² As previously mentioned, Merced County has a young average age, and not surprisingly has the 7th highest fertility rate in the state (63.9 per 1,000). The fertility rate in Merced County is 21.9% higher than California’s (52.4). The percent of infants born at low birthweight is lower in Merced County (5.9%) than California (6.9%).² The average birthweight (in pounds) for Merced County is 7.3, which is higher than the state average of 7.2.¹
Merced County's teen birth rate is 1.7 times higher than California's and continues to be in the top 10 counties in the state.²
Birth Rate by Location,
2016-2020
Merced County
California
United States
20
15
10
5
0
2016
2017
2018
2019
2020
RATE PER 1,000
15.32
12.45
12.21
15.41
11.93
11.84
14.1
11.59
11.5
13.71
11.42
11.3
13.36
10.68
YEAR
Source: CDC Wonder
Merced County's infant mortality rate is the 5th highest in California.
One area for concern is that the average pre-pregnancy body mass index (BMI) in Merced County is 29.2, which is the highest county in the state (27.2).¹
Another way to reduce the risk of pregnancy complications and reduce fetus and infant risk for complications is regular prenatal care. As mentioned in the Healthcare Access and Quality section, Merced County is a medically underserved area, and the data for rates of prenatal visits supports this. Merced County (10.8 per 1,000) has the 7th lowest rate of prenatal visits in the state (11.5).
Potentially related to these factors (high pre-pregnancy BMI, lower number of prenatal visits), the infant mortality rate in Merced County (5.5 per 1,000) is the 5th highest in the state (4.2), and similar to the national average (5.6).¹
Having a high BMI during pregnancy is also linked to an increased risk of health problems for the baby, including:³
- Congenital disorders
- Growth problems
- Childhood asthma
- Childhood obesity
- Cognitive problems and developmental delay
Having a high BMI and being pregnant increases the risk for various pregnancy complications, such as:³
- Miscarriage, still birth and recurring miscarriage
- Gestational diabetes, which can increase risk for diabetes after pregnancy
- A pregnancy complication characterized by high blood pressure and signs of damage to another organ system most often the liver and kidneys
- Heart problems
- Sleep apnea
- The need for a C-section
- The risk for C-section complications, such as wound infections
Potential Causes of Infant Mortality
- Birth defects
- Pre-term and low birth weight
- Sudden infant death syndrome (SIDS)
- Injuries/Accidents (for example suffocation)
Maternal Risk Factors Associated with Fetal and Infant Mortality
- Obesity
- Diabetes
- Hypertension (high blood pressure)
- Substance use
- Tobacco use
- Human Immunodeficiency Virus (HIV)
- Rural Residence
- Psychosocial Stressors
Breastfeeding
Merced County continues to have lower percentages of mothers who exclusively breastfeed (60.4%), measured in the hospital after delivery, compared to California (70.4%). A slightly higher percentage of Black mothers in Merced County (62.2%) exclusively breastfeed compared to California (61.5%), whereas all the other race/ethnicity groups have lower rates in Merced County compared to the state. Mothers who identified as other race/ethnicity have the lowest percentage of exclusively breastfeeding in Merced County (34.9%; 65.1% California), followed by Asian mothers (46.9%; 65.8% California) and mothers who identified as multiple race (55.4%; 76.2% California). Percentages for all three of these groups are much lower in Merced County compared to California.⁴ Although a high percentage of mothers start out exclusively breastfeeding their child, only 13.0% of babies are exclusively breastfed after six months.⁵
Average Percent Exclusive Breastfeeding Merced County & California, 2018
3
3
Merced County
California
100%
75%
50%
25%
0%
61.5%
65.8%
46.9%
70.6%
66.3%
59.0%
76.2%
55.4%
65.1%
34.9%
African American
Asian
White
Hispanic
Multiple Race
Other
PERCENT
62.2%
Source: CDPH
RACE

Possible Solutions to Promote Breastfeeding
- Employers providing adequate paid leave for taking care of a newborn and recovering from pregnancy, since mothers with longer maternity leaves are more likely to continue to breastfeed even after returning to work
- Employers providing safe and sanitary places for mothers to pump and store milk once they return to work
- Employers provide resources on breastfeeding rights while at work to employees
- Provide resources available in the community to help educate new mothers on the importance and health benefits of breastfeeding
Child and Adolescent Health
Foster Care and Immunization Rates
Health problems developed in childhood and adolescence can linger for the entire life span. This section will focus on the health outcomes of Merced County children and adolescents, as well as highlight some of the factors that affect the health of these populations.
Merced County has higher rates of first entry into foster care than the state at every age group, with the exception of ages 11-15.
Rate of First Entry into Foster Care, by Age and Location, 2012- 2014 Average
Merced County
California
15
10
5
0
Under 1
Ages 1-2
Ages 3-5
Ages 6-10
Ages 11-15
Ages 16-17
RATE PER 1,000
13.0
12.2
4.3
3.6
3.1
2.6
2.5
1.9
1.3
1.4
1.4
1.2
AGE RANGE
Source: kidsdata.org
543 children in Merced County are in Foster Care, which is the lowest in recent years after peaking in 2014 at 649.¹
The median number of months a child spends in Foster Care in Merced County reached the highest number in recent years in 2016 at 16.7 months, but is now on the start of a downward trend, and are consistently lower than the state.
Median Number of Months in Foster Care by Location, 2007 to 2017
Merced County
California
20
15
10
5
0
13.3
13.2
13.2
13.9
14.1
15.2
15.6
15.4
15.8
16.7
17.4
2007
2008
2009
2010
2011
2012
2013
2014
2015
2016
2017
NUMBER OF MONTHS
10.6
9.8
9.9
10.0
10.4
13.6
12.8
11.5
13.9
16.7
12.7
YEAR
Source: kidsdata.org
Immunizations (Medi-Cal Patients)
The basic childhood immunization combo consists of: Hepatitis B; 2 or 3 Rotavirus; 4 Diphtheria, tetanus, & acellular pertussis; 3 Haemophilus influenzae type b; Pneumococcal conjugate; 3 Polio; 3 Haemophilus influenzae type b; 1 Measles, Mumps, and Rubella; 1 Varicella; 1 Hepatitis A; and 2 Influenza (flu) vaccines on or before the 2nd birthday.
Merced County Medi-Cal Vaccination Rates, 2021
PERCENT
60.5%
29.2%
68.8%
81.9%
77.5%
84.0%
62.8%
79.4%
61.0%
83.6%
100%
75%
50%
25%
0%
DTaP
Flu
HEP B
HEP A
HIB
MMR
Pneumococcal Conjugate
IPV
Rotavirus
VZV
Source: CCAH HEDIS Data
VACCINATION
Merced County Medi-Cal Two Year Olds with Completed Basic Childhood Vaccination Combination by Race/Ethnicity, 2021
PERCENT
20.0%
25.0%
3.7%
37.5%
14.6%
18.4%
12.1%
14.1%
40%
30%
20%
10%
0%
Asian Indian
Asian or Pacific Islander
Black
Chinese
Filipino
Hispanic
Other
White
RACE
Source: CCAH HEDIS Data
The percent of kindergarteners with all required vaccinations in 2019 for Merced County was 97.5%, which was tied for the 3rd highest California county.¹ In comparison to recent years, childhood vaccination rates have decreased in Merced County for 2021. One possible explanation is because of the COVID-19 pandemic. During the pandemic, there were lockdowns and one of the results was that people, including children, were not able to access health services as easily. Most childhood vaccinations rates are higher than 60%, with the only exception being flu (29.2%). There are race/ethnicity differences in who receives the basic childhood combination of vaccines: Asians have the highest level of compliance (37.5%) and Black people have the lowest (3.7%).³
Gang Memberships
Gangs have many negative impacts on both the gang-involved youth, and in surrounding communities. Youth involved in gangs are more likely to drop out of school, experience teen pregnancy, use substances, and be involved in the justice system. Communities with high levels of gang activity have higher levels of crimes such as theft, assault, vandalism, drug trades, and gun violence. Merced County rates of gang membership are slightly lower than the state for 7th (Merced County: 3.9%, California: 4.0%), 9th (Merced County: 3.3%, California: 4.0%), and 11th graders (Merced County: 3.1%, California: 4.1%).¹ Merced County also has very high rates of teen pregnancy. For a full discussion of this important health concern, see the Pregnancy and Birth section.
Rates of gang membership for 7th, 9th, and 11th graders in Merced County are lower than in California.¹

Possible Solutions to Improve Child
and Adolescent Health
- Increase access to college preparatory courses for high school students
- Increase the number of children receiving their immunizations by providing information on the benefits and offer convenient locations to receive doses
- Provide transportation to and from medical appointments
- Provide children, especially those that are socioeconomically disadvantaged, additional resources such as tutoring, to put them in the best possible position to be successful
- Provide safe spaces outdoors for children to play and participate in organized sports and activities
Obesity
A Changeable Health Risk in Merced County
Obesity is a modifiable risk factor that is associated with increased risk of almost all of the top causes of mortality in Merced County (heart disease, COVID-19, cancer, stroke, diabetes, and chronic lung disease).
Relationship of Weight Status and Health Issues, Merced County, 2018
Healthy Weight
Overweight
Obese
50%
40%
30%
20%
10%
0%
46.2%
32.8%
40.1%
35.5%
18.5%
15.5%
18.5%
20.1%
23.9%
14.2%
7.5%
High Blood Pressure
Fair/Poor Health
Activity Limitations
Diabetes
PERCENT
22.3%
HEALTH ISSUE
Source: 2018 Merced Needs Assessment
Historically, Merced County has higher rates of adults who are overweight or obese compared to both the state and United States. There is data that suggests this pattern begins in early childhood, as a higher percent of children in school are overweight or obese in Merced County than California. This health concern is important because compared to children at a healthy weight, children with obesity are at much higher risk for developing a range of health problems, including high blood pressure, asthma, type 2 diabetes, and high cholesterol. In addition, children who are overweight or obese are much more likely to become obese as adults.¹ In addition, childhood obesity is linked to social and emotional difficulties including anxiety, depression, and bullying. There are several specific factors that put Merced County children at a major disadvantage for developing obesity. For example, 33.0% of children spend eight or more hours on sedentary activities (such as watching television, playing video games, sitting) on typical weekend days in Merced County compared to only 18.2% for California.² This could possibly be due to neighborhood and built environment factors, such as not feeling safe to play outside because of community violence or a lack of resources for organized sports/play, that were discussed in the Social Determinants of Health chapter.
Students Who are Overweight or Obese, by Grade Level and Location, 2019
Merced County
California
50%
40%
30%
20%
10%
0%
41.3%
45.6%
40.0%
45.9%
37.8%
Grade 5
Grade 7
Grade 9
PERCENT
49.1%
Source: kidsdata.org
GRADE LEVEL
Merced County (37.8%) has higher rates of obese (Body Mass Index (BMI) of 30 or higher) adult residents compared to California (28.5%) and the United States (31.9%). When examining differences by gender in Merced County, a higher percent of females are overweight (BMI between 25-29.99) compared to males (42.0% and 39.0%, respectively). However, a higher percent of males (42.0%) are obese compared to females (34.5%) in the county. This is a different trend compared to California, where there is a higher percent of males who are overweight compared to females (39.0% and 28.1% respectively), while more females than males are obese (29.4% and 27.6%, respectively).²
81% of adult males and 76.5% of adult females in Merced County are overweight or obese, compared to 66.6% and 57.5% for males and females, respectively, in California.²
About 3 in 10 overweight/obese adults in Merced County have been given advice about their weight by a health professional in the past year.⁴
Although there is limited data for obesity by all race/ethnicities for Merced County, one interesting finding is that the percent of obese Latino adults in Merced County (39.7%) is similar to California (36.6%). However, the percent of white people who are obese in Merced County (45.3%) is over 20.0% higher than in California (24.6%), even though the percent of White people who are overweight is similar between both Merced County (30.6%) and California (33.2%).² Obesity is more prevalent in adults with lower income and those ages 40 to 64.
Prevalence of Obesity in Adults by Gender, Age, and Income, Merced County
50%
40%
30%
20%
10%
0%
34.5%
31.0%
48.5%
27.8%
38.9%
35.0%
Men
Women
18 to 39
40 to 64
65+
Low Income
Mid/High Income
PERCENT
42.0%
Source: CHIS and 2018 Mercy Needs Assessment

Possible Solutions to Reduce Obesity
- Provide fitness center at worksite and allow employees to use it during breaks and lunch
- Employer provided chronic disease self-management programs/national diabetes prevention program
- Organize community events related to physical activity and nutrition, for example a walk-a-thon
- Ensure all neighborhoods have maintained sidewalks and walking paths that are clean and safe
- Increase access to healthy foods, especially in food desert and food swamp areas
References
Merced County Overview
Population Characteristics
- US Census Bureau, Quick Facts, Merced County available HERE
- US Census Bureau, Explore Census Data, Merced County available HERE
- US Census Bureau, American Community Survey 2015-2019, LINK
- Merced County Office of Education, Merced County Highlights, LINK, retrieved May 2023
- Town Charts, Merced County Education Attainment Charts, LINK, retrieved May 2022
- Spark Map, LINK, retrieved April 2022
- Registration by County, LINK, retrieved May 2023
Social Determinants of Health
- Healthy People 2030, Social Determinants of Health, LINK, retrieved May 2022
Healthcare Access and Quality
- Community Commons, LINK, retrieved October 2020
- UCM Health Services Research and Policy, Rural and Underserved Areas of California, LINK, retrieved October 2020
- Merced County Department of Public Health Community Health Survey, 2022
- US Census Bureau, American Community Survey 2015-2019, LINK
- California Health Places Index, Retrieved July 2022
- Peterson-KFF Health System Tracker, How does cost affect access to care?, LINK, retrieved May 2021
- Health Consequences of Uninsurance among Adults in the United States: Recent Evidence and Implications available HERE
- Primary Care Collaborative, Association of American Medical Colleges 2020, The Complexities of Physician Supply and Demand: Projections from 2018-2033, LINK, retrieved May 2021
- County Health Rankings & Roadmaps, Mental Health Providers, Accessed June 2022
- California Health Interview Survey, 2017-2020
- Centers for Medicare and Medicaid Services, Mapping Medicare Disparities Tool available HERE
Education Access and Quality
- The Relationship Between Education and Health: Reducing Disparities Through a Contextual Approach available HERE
- US Census Bureau, Quick Facts, Merced County available HERE
- Town Charts, Merced County Education Attainment Charts, LINK, retrieved May 2022
- Town Charts, California Education Attainment Charts, LINK, retrieved May 2022
- Town Charts, United States Education Attainment Charts, LINK, retrieved May 2022
- Merced County Department of Public Health Community Health Survey, 2022
- Kidsdata.org LINK
- Murphy, P., et al. (2019). Higher education in California. Public Policy Institute of California
- Virginia Commonwealth University, Why Education Matters to Health: Exploring the Causes, available HERE
- US Census Bureau, American Community Survey 2015-2019, LINK
- University of California, Merced, Datausa.io, retrieved August 2022
- UC Merced, LINK, retrieved August 2022
- Merced College, Datausa.io, LINK retrieved August 2022
Economic Stability
- US Department of Labor, Bureau of Labor Statistics, retrieved May 2022
- Merced County Department of Public Health Community Health Survey, 2022
- US Census Bureau, American Community Survey 2015-2019, LINK
- Redfin, retrieved May 2022
- Money Geek, 26 Places in the US Where Homeownership Has Become Unaffordable, LINK, retrieved May 2022
- US Census Bureau, Quick Facts, Merced County available HERE
- RentData.org, LINK
- Merced County Behavioral Health and Recovery Services, Homeless Plan, LINK
- Kidsdata.org LINK
- Invest Merced California, accessed September 2022
Neighborhood and Built Environment
- US Census Bureau, American Community Survey 2015-2019, LINK
- Federal Bureau of Investigation, FBI Uniform Crime Reports 2014 & 2016
- Community Commons, www.communitycommons.org, retrieved October 2020
- California Department of Justice, Crime Data
- Merced County Department of Public Health Community Health Survey, 2022
- USDA Economic Research Service, Food Access Research Atlas, LINK, retrieved May 2022
- US Census Bureau, County Business Patterns, retrieved May 2022
- United Nations Economic Commission for Europe, Air Pollution and Health, LINK
- Billings P. G., Nolen J. E., Tran T. A., et al. State of the Air 2016. Chicago, Ill, USA: American Lung Association; 2016.
- American Lung Association, Most Polluted Places to Live, retrieved May 2022
- Centers for Disease Control and Prevention, National Environmental Public Health Tracking Network, 2016
- Cisneros R, Brown P, Cameron L, et al. Understanding Public Views about Air Quality and Air Pollution Sources in the San Joaquin Valley, California. J Environ Public Health. 2017; LINK
- World Health Organization, Climate Change and Health, LINK retrieved September 2022
- National Centers For Environmental Information, Climate at a Glance, 2021 data, LINK retrieved September 2022
- Valley Children’s Health Care, Community Health Needs Assessment 2019 Report, LINK
Health of the Community
Leading Causes of Death
- Merced County Department of Public Health 2021 Death Report
Cardiovascular Disease
- CDC Wonder Online Query System, Centers for Disease Control and Prevention, Underlying Cause of Death, 2011-2020
- Office of Statewide Health Planning and Development, Patient Discharge and Emergency Department Data, 2019
- 2018 Community Health Needs Assessment Report, Mercy Medical Center Merced
- California Department of Public Health, California Community Burden of Disease Engine, LINK, retrieved May 2022
COVID-19
- Local Merced County Department of Public Health Disease Surveillance Data
- Merced County Department of Public Health 2021 Death Report
- Czeisler MÉ, Marynak K, Clarke KE, et al. Delay or Avoidance of Medical Care Because of COVID-19–Related Concerns — United States, June 2020. MMWR Morb Mortal Wkly Rep 2020;69:1250–1257
Malignant Neoplasms (Cancer)
- CDC Wonder Online Query System, Centers for Disease Control and Prevention, Underlying Cause of Death, 2016-2020
- National Cancer Institute, State Cancer Profiles, LINK, 2014-2018
- Centers for Medicare and Medicaid Services, Mapping Medicare Disparities Tool, 2019
- California Health Interview Survey, 2020
- California Department of Public Health, California Community Burden of Disease Engine, LINK, retrieved May 20
Accidents (Unintentional Injuries)
- CDC Wonder Online Query System, Centers for Disease Control and Prevention, Underlying Cause of Death, 2006-2020
- Merced County Department of Public Health Community Health Survey, 2022
Cerebrovascular Disease (Stroke)
- CDC Wonder Online Query System, Centers for Disease Control and Prevention, Underlying Cause of Death, 2006-2020
- 2018 Community Health Needs Assessment Report, Mercy Medical Center Merced
- Office of Statewide Health Planning and Development, Patient Discharge and Emergency Department Data, 2019
- California Department of Public Health, California Community Burden of Disease Engine, LINK, retrieved June 2022
Chronic Lower Respiratory Disease
- Very Well Health, An Overview of Chronic Lower Respiratory Disease (CLRD), LINK, Retrieved May 2022
- Office of Statewide Health Planning and Development, Patient Discharge and Emergency Department Data, 2019
- CDC Wonder Online Query System, Centers for Disease Control and Prevention, Underlying Cause of Death, 2006-2020
- 2018 Community Health Needs Assessment Report, Mercy Medical Center Merced
- California Department of Public Health, Environmental Health Investigations Branch, California Asthma Dashboard, Retrieved May 2022
- California Health Interview Survey, 2020
- Garthwaite, Craig, et al. All Medicaid expansions are not created equal: the geography and targeting of the Affordable Care Act. No. w26289. National Bureau of Economic Research, 2019.
- World Health Organization, Asthma, LINK, Retrieved May 2022
Diabetes Mellitus
- Office of Statewide Health Planning and Development, Patient Discharge and Emergency Department Data, 2019
- CDC Wonder Online Query System, Centers for Disease Control and Prevention, Underlying Cause of Death, 2006-2020
- 2018 Community Health Needs Assessment Report, Mercy Medical Center Merced
- CDC, National Center for Chronic Disease Prevention and Health Promotion, 2019
- 2018 Community Health Needs Assessment Report, Mercy Medical Center Merced
- California Health Interview Survey, 2018
Most Important Health Problems
- Merced County Department of Public Health Community Health Survey, 2022
Other Infectious/Contagious Disease
- Local Merced County Department of Public Health Disease Surveillance Data
- County Health Rankings & Roadmaps, Flu Vaccinations, Accessed July 2022
- California Department of Public Health, Tuberculosis Disease Data and Publications, CA Provisional Data Tables 2021
HIV/AIDS & Other STIs
- CDC Wonder Online Query System, Centers for Disease Control and Prevention, Underlying Cause of Death, 2017-2020
- California HIV/AIDS Policy Research Centers, California HIV Statistics by County, Merced County, 2018
- California Health Interview Survey, 2020
- Local Merced County Department of Public Health Disease Surveillance Data
- California Department of Public Health, STD Branch, Local Health Jurisdictional Data, LINK
- Merced County Department of Public Health Community Health Survey, 2022
Aging Population
- US Census Bureau, American Community Survey 2015-2019, LINK
- Merced County Department of Public Health 2021 Death Report
- CDC Wonder Online Query System, Centers for Disease Control and Prevention, Underlying Cause of Death, 2006-2020
- CDC, Centers for Disease Control and Prevention, Chronic Disease Fact Sheets, Arthritis, retrieved June 2022
- CDC, Centers for Disease Control and Prevention, Arthritis Data and Statistics
Mental Health
- 2018 Community Health Needs Assessment Report, Mercy Medical Center Merced
- Office of Statewide Health Planning and Development, Patient Discharge and Emergency Department Data, 2019
- USNews.com, Healthiest Communities, LINK, retrieved June 2022
- CDC Wonder Online Query System, Centers for Disease Control and Prevention, Underlying Cause of Death, 2006-2020
- Merced County Department of Public Health Community Health Survey, 2022
- World Health Organization, LINK, retrieved June 2022
Substance Abuse
- CDC Wonder Online Query System, Centers for Disease Control and Prevention, Underlying Cause of Death, 2009-2020
- Merced County Department of Public Health Community Health Survey, 2022
- University of Wisconsin Population Health Institute, County Health Rakings, 2018
- 2018 Community Health Needs Assessment Report, Mercy Medical Center Merced
- Countyhealthrankings.org LINK
- California Health Interview Survey, 2020
- Kidsdata.org LINK
Oral Health
- Zivkovic N, et al. Providing dental insurance can positively impact oral health outcomes in Ontario. BMC Health Serv Res. 2020; LINK
- California Health Interview Survey, 2013 & 2020
- Manz, M.C. (Updated January 2021). Recommended Guidelines for Surveillance of Non-Traumatic Dental Care in Emergency Departments. Reno, NV: Association of State & Territorial Dental Directors
- County Health Rankings & Roadmaps, Dentists, Accessed June 2022
- The American Academy of Pediatrics, Good Oral Health Starts Early, LINK , Retrieved June 2022
- Kidsdata.org LINK
Other Health Topics
Pregnancy and Birth
Child and Adolescent Health
- Kidsdata.org LINK
- Central California Alliance for Health (CCAH) HEDIS Immunization Data, Merced County, 2021
- Adverse Effects | Youth.gov, LINK
Obesity
- Kidsdata.org LINK
- California Health Interview Survey, 2020
- CDC, Behavioral Risk Factor Surveillance System, 2020
- 2018 Community Health Needs Assessment Report, Mercy Medical Center Merced
Resources
Glossary
BMI: Body Mass Index
BMI is defined by MedicineNet.com as a key index for relating weight to height. BMI is a person's weight in kilograms (kg) divided by his or her height in meters squared. The National Institutes of Health (NIH) now defines normal weight, overweight, obesity according to BMI rather than the traditional height/weight charts. A very muscular person might have a high BMI without health risks.
- Obesity: Obesity is defined by MedicineNet.com as the state of being well above one's normal weight. A person has traditionally been considered to be obese if they are more than 20 percent over their ideal weight. That ideal weight must take into account the person's height, age, sex, and build.
Obesity has been more precisely defined by the National Institutes of Health (the NIH) as a BMI of 30 and above. (A BMI of 30 is about 30 pounds overweight.) For adult men and women, a BMI between 18.5 and 24.9 is considered healthy.
The Harvard T. H. Chan School of Public Health indicates that decades of research have shown that the BMI correlates well with important health outcomes like heart disease, diabetes, cancer, and overall mortality.
- Overweight: The Centers for Disease Control (CDC) defines overweight as a BMI(BMI) between 25.0 and 29.9. Body Mass Index (BMI) is a person's weight in kilograms divided by the square of height in meters. A high BMI can be an indicator of high body fatness. BMI can be used as a screening tool but is not diagnostic of the body fatness or health of an individual.
The following guidelines have been developed:
- A BMI less than 18.5 falls within the underweight range.
- A BMI between 18.5 and 24.9 is considered to be within the normal or healthy weight range.
- A BMI between 25.0 and 29.9 falls within the overweight range.
- A BMI that is 30.0 or higher falls within the obese range.
Census Track
According to census.gov, a census tract is a small, relatively permanent statistical subdivision of a county that can be updated by local participants prior to each decennial census a part of the Census Bureau’s Participant Statistical Areas Program (PSAP). The purpose of census tracts is to provide a stable set of geographic units for the presentation of statistical data. Census tracts typically have a population size between 1,200 and 8,000 people. The spatial size of a census tract varies widely depending on the population density.
Ethnicity/Race
An ethnic group or ethnicity is a population group whose members identify with each other on the basis of common nationality or shared cultural traditions.
The term race refers to the concept of dividing people into populations or groups on the basis of various sets of physical characteristics (which usually result from genetic ancestry). Although races are assumed to be distinguished by skin color, facial type, etc., the scientific basis of racial distinctions is very weak except in skin color. The census officially recognizes six ethnic and racial categories: White American, Black or African American, Native American and Alaska Native, Asian American, Native Hawaiian and Other Pacific Islander, and people of two or more races; a race called "Some other race" is also used in the census and other surveys, but is not official. The United States Census Bureau also classifies Americans as "Hispanic or Latino" and "Not Hispanic or Latino", which identifies Hispanic and Latino Americans as a racially diverse ethnicity that composes the largest minority group in the nation.
In this report, we have used the following abbreviations for racial or ethnic groups:
- AA/B: African American/Black
- H/L: Hispanic/Latino
- White: White
- Asian: Asian
The population of Native American/Alaskan Native and Native Hawaiian/Pacific Islander people is so small in Merced County that those subgroups are not able to be analyzed separately.
Food Desert
An area or region where people have limited access to healthy and affordable foods due to factors such as having limited income or living too far away from healthy and affordable food.
Food Swamp
According to the CDC, a food swamp is an area or region/environment saturated with unhealthy foods because of a large number of fast-food restaurants and corner stores. In the US, food swamps are defined as areas with 4 or more corner stores within 0.25 miles of home or where the ratio of unhealthy to healthy food establishments exceeds 3.89. In the US, low-income and racial/ethnic minority populations are more likely than higher-income white populations to live in food swamps.
HEDIS: The Healthcare Effectiveness Dat and Information Set
The Healthcare Effectiveness Data and Information Set (HEDIS), developed and maintained by the National Committee for Quality Assurance (NCQA), is a set of performance measures used to assess the quality of care provided by managed health care organizations. It was formerly the Health Plan Employer Data and Information Set. HEDIS Measure Determination Standards (HD) are the standards that auditors use during the audit process to assess a health plan’s adherence to HEDIS measure specifications.
The California Department of Healthcare Services (DHCS) establishes the minimum performance level (MPL) as the most recent national HEDIS Medicaid 25th percentile,
except for one measure, Comprehensive Diabetes Care—HbA1c Poor Control
(>9.0 Percent). For this measure, a lower rate indicates better performance, with the 10th percentile (rather than the 90th percentile) showing excellent performance. The MPL for this measure is the 75th percentile.
HEDIS Audit Finding is the auditor’s final determination, based on audit findings, of the appropriateness of the health plan and this is publicly reported information. Each measure included in the HEDIS audit receives a Reportable, Small Denominator, Not Reportable, or Benefit Not Offered audit finding.
HPSA: Health Professional Shortage Area
Health Professional Shortage Areas (HPSAs) are designated by Health Resources and Services Administration (HRSA) in the Public Health Service Act as having shortages of primary medical care, dental or mental health providers. HPSAs may be urban and rural geographic areas (a county or service area), demographic (e.g., a population group such as low-income population) or a facility which has a shortage of health professionals (e.g., a comprehensive health center, federally qualified health center or other public facility). Medically Underserved Areas/Populations are areas or populations designated by HRSA as having: too few primary care providers, high infant mortality, high poverty and/or high elderly population.
Incidence
According to the Harvard T. H. Chan School of Public Health, incidence refers to the number of individuals who develop a specific disease or experience a specific health-related event during a particular time period (such as a month or year).
Income Categories
>100% FPL: Income categories reflect respondent’s household income as a ratio to the federal poverty level (FPL) for their household size. “Mid/High Income” includes households with incomes at 100% or more of the federal poverty level.
<100% FPL: Income categories reflect respondent’s household income as a ratio to the federal poverty level (FPL) for their household size. “Low Income” includes households with incomes up to 100% of the federal poverty level.
Morality Rates
A mortality rate, or death rate, is a measure of the number of deaths per 100,000 people in the population, due to a specific cause. For example, cancer mortality is calculated as (Cancer Deaths/Population) x 100,000.
MUA: Medically Underserved Areas
Medically Underserved Areas/Populations are areas or populations designated by Health Resources & Services Administration (HRSA) as having too few primary care providers, high infant mortality, high poverty or a high elderly population.
PM: Particulate Matter
Term for the mixture of solid particles and liquid droplets found in air.
- PM10: Inhalable particles, with diameters 10 micrometers and smaller
- PM2.5: Fine inhalable particles, with diameters 2.5 micrometers and smaller
Prevalence
According to the Harvard T. H. Chan School of Public Health, prevalence refers to the total number of individuals in a population who have a disease or health condition at a specific period of time, usually expressed as a percentage of the population.
SES: Socioeconomic Status
According to the American Psychological Association, SES is the social standing or class of an individual or group, usually measured as a combination of education, income, and occupation.
Social Cohesion
According to healthypeople.gov, social cohesion refers to the strength of relationships and the sense of solidarity among members of a community. The amount of social capital a community has is a strong indicator of social cohesion. Social capital deals with shared group resources; for example, a friend-of-a-friend’s knowledge of a potential job opening. People have access to social capital through their social networks. Social networks are sources of multiple forms of social support, such as emotional (encouragement after setback or hardship) and instrumental (a car ride to the doctor) support.
Substandard Housing
The Department of Housing and Development (HUD) defines “substandard” to mean housing which is dilapidated, without operable indoor plumbing or a usable flush toilet or bathtub inside the unit for the family’s exclusive use, without electricity or with inadequate or unsafe electrical service, without a safe or adequate source of heat, and should but does not have a kitchen, or has otherwise been declared unfit for habitation by the government.
Urban and Rural Population
The Federal Office of Rural Health Policy (ORHP) defines rural as located outside a Metropolitan Statistical Area (MSA), or located in a rural census tract of a MSA as determined under the Goldsmith Modification or the Rural Commuting Areas. The Bureau of the Census classifies "urban" as territory, population, and housing units located within an urbanized area (UA) or an urban cluster (UC), which has a population density of at least 1,000 people square mile and surrounding census blocks with an overall density of at least 500 people per square mile. The Bureau of the Census classifies "rural" as all territory, population and housing units located outside of UAs and UCs.
Years of Life Lost (YLL)
A measure that sums all the years of life prematurely lost across all people that die from a specific condition. YLL is influenced by the age at which people die from the condition and the number of people that die from that condition. Diseases that kill younger people have higher YLL. For example, a child who dies in a car accident will have a higher YLL than an elderly person who dies of Alzheimer's.
Social Determinants
of Health
Overview
Healthcare Access and Quality
Education Access and Quality
Social and Community Context
Economic Stability
Neighborhood and Built Environment
Social Determinants of Health Summary